2003 Membership
The reduced subscription to existing members
will run for at least 4 weeks
after all the data is in place and the free trial commences.
Subscription/Registration forms will be available from the start of the free trial period.
We will keep you informed of progress.
after all the data is in place and the free trial commences.
Subscription/Registration forms will be available from the start of the free trial period.
We will keep you informed of progress.
Trading Diary
January 16, 2003
These extracts from my daily trading diary are
intended to illustrate the techniques used in short-term trading
and should not be interpreted as investment advice. Full terms
and conditions can be found at Terms
of Use .
USA
The Dow formed an inside day, down 0.3% at 8697.
The short-term trend is weak.
The average is ranging between 8161 and 9076, at the top end of the base that has been forming since July 2002; a bullish sign.
The primary trend is down and will only reverse up if the average rises above 9076 (the high from December 02).
The Nasdaq Composite lost 1.0% to close at 1423.
The primary trend is up.
The S&P 500 lost 4 points to close at 914. The short-term trend shows weakness.
The index ranges between 965 and 768, establishing a base. It has recently held above 867; a bullish sign.
The Chartcraft NYSE Bullish % Indicator increased to 52% (January 15).
Iraq tension drives gold
The likelihood of another gulf war draws closer as UN weapons inspectors find empty chemical warheads.
Gold
New York: Spot gold reached a 5-year high, up 690 cents at $US 357.50
The likelihood of another gulf war draws closer as UN weapons inspectors find empty chemical warheads.
Gold
New York: Spot gold reached a 5-year high, up 690 cents at $US 357.50
ASX Australia
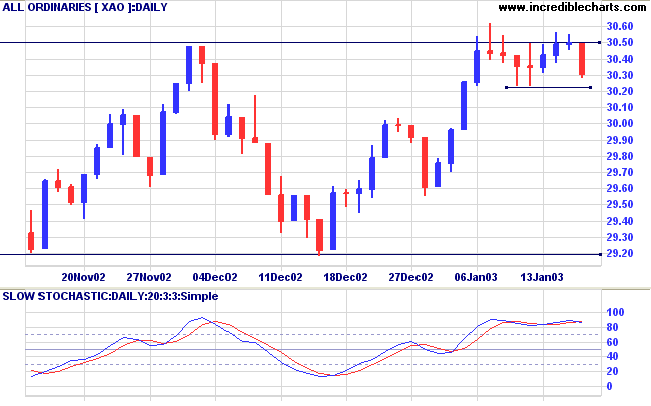
The All Ordinaries retreated to close at 3030, after failing to
hold above the 3050 resistance level, a bearish sign.
The index ranges between 2915 and 3050, forming a base.
Slow Stochastic (20,3,3) has crossed to below its signal line; MACD (26,12,9) is above; Twiggs money flow is falling.
The index ranges between 2915 and 3050, forming a base.
Slow Stochastic (20,3,3) has crossed to below its signal line; MACD (26,12,9) is above; Twiggs money flow is falling.
Harvey Norman [HVN]
Last covered on
August 14, 2002.
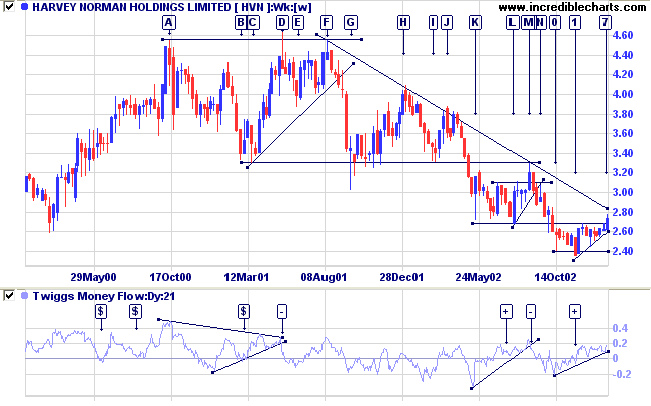
HVN formed a triple top at [A], [D] and [F] before entering a stage 4 down-trend. Note the false break at [D]; a strong bear signal.
The stock then appeared to form a base at [K] to [L], followed by a break above resistance at [M]. This proved to be a bull trap, with a break below the trendline at [N]; a very reliable bear signal if traders are able to reverse their mind-set quickly enough to catch it. We are now presented with another potential bottom: a low at [0] followed by a false break at [1] and an ascending triangle to [7].
Relative strength (price ratio: xao) is starting to rise; MACD has completed a bullish divergence but has not yet broken above the long-term trendline; Twiggs money flow signals accumulation, having completed a bullish divergence [+].
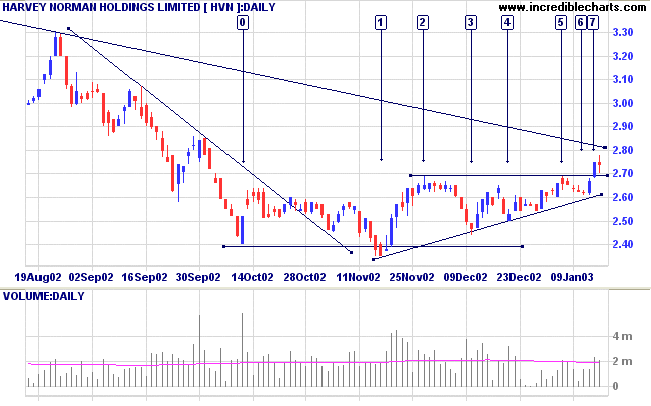
The daily chart shows a low at [0] followed by a false break at
[1], with no increase in volume until the break back above
2.40. This formed the start of an ascending triangle, completed
by a breakout at [7]. Short term traders may have entered at
[6], spurred by the low volume and short duration of the
counter-trend. The bullish triangle had some degree of volume
confirmation with volume rising on each of the rallies.
HVN is now forming a congestion pattern just above the new support line. A break above the congestion pattern, especially if accompanied by strong volume, will be a bullish signal.
HVN is now forming a congestion pattern just above the new support line. A break above the congestion pattern, especially if accompanied by strong volume, will be a bullish signal.
Stops should be kept tight as recoveries from a narrow base are
prone to failure.
Conservative traders may wait until the stock has broken above the long-term trendline, on the weekly chart or on the MACD indicator.
Conservative traders may wait until the stock has broken above the long-term trendline, on the weekly chart or on the MACD indicator.
Market strategy
For further guidance see Understanding the Trading Diary.
For further guidance see Understanding the Trading Diary.
Short-term: Avoid new entries. The Slow Stochastic and MACD are
on opposite sides of their respective signal lines.
Medium-term: Avoid new entries.
Long-term: Wait for confirmation of the
bottom reversal signal.
Colin Twiggs
To eliminate fear we must embrace it.
- Another paradox. To conquer our fear we must not fight it but accept it.
- Another paradox. To conquer our fear we must not fight it but accept it.
Back Issues
Click here to access the
Trading Diary Archives.
Back Issues
Access the Trading Diary Archives.

Author: Colin Twiggs is a former investment banker with almost 40 years of experience in financial markets. He co-founded Incredible Charts and writes the popular Trading Diary and Patient Investor newsletters.
Using a top-down approach, Colin identifies key macro trends in the global economy before evaluating selected opportunities using a combination of fundamental and technical analysis.
Focusing on interest rates and financial market liquidity as primary drivers of the economic cycle, he warned of the 2008/2009 and 2020 bear markets well ahead of actual events.
He founded PVT Capital (AFSL No. 546090) in May 2023, which offers investment strategy and advice to wholesale clients.