2003 Membership
The reduced subscription to existing members
will run for at least 4 weeks
after all the data is in place and the free trial commences.
Subscription/Registration forms will be available from the start of the free trial period.
We will keep you informed of progress.
after all the data is in place and the free trial commences.
Subscription/Registration forms will be available from the start of the free trial period.
We will keep you informed of progress.
Trading Diary
January 15, 2003
These extracts from my daily trading diary are
intended to illustrate the techniques used in short-term trading
and should not be interpreted as investment advice. Full terms
and conditions can be found at Terms
of Use .
USA
The Dow lost 1.3% to close at 8723. The last
short-term rally failed to make significant gains and volume is
up on the counter-trend; both are bearish signs in the
short-term.
The average is ranging between 8161 and 9076, at the top end of the base that has been forming since July 2002; a bullish sign.
The primary trend is down and will only reverse up if the average rises above 9076 (the high from December 02).
The Nasdaq Composite lost 1.5% to close at 1438.
The primary trend is up.
The S&P 500 formed an outside day, closing down 13 points at 918. The short-term trend shows weakness.
The index ranges between 965 and 768, establishing a base. It has recently held above 867; a bullish sign.
The Chartcraft NYSE Bullish % Indicator increased to 52% (January 14).
Technology
Intel beat earnings forecasts for the fourth quarter but its cautious outlook for 2003 has placed a damper on the technology sector.
Apple posted a loss after restructuring charges.
Gold
New York: Spot gold eased 30 cents to $US 350.60
Intel beat earnings forecasts for the fourth quarter but its cautious outlook for 2003 has placed a damper on the technology sector.
Apple posted a loss after restructuring charges.
Gold
New York: Spot gold eased 30 cents to $US 350.60
ASX Australia
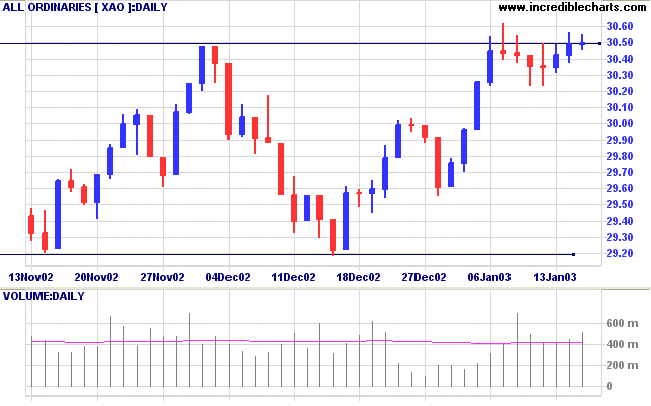
The All Ordinaries formed an inside day, closing at 3050 on
higher volume. The index again failed to hold above the
resistance level, a bearish sign.
The index ranges between 2915 and 3050, forming a base. A break out of the base will signal a primary trend change to an up-trend. Look for volume confirmation.
Slow Stochastic (20,3,3) has crossed to above its signal line; MACD (26,12,9) is above; Twiggs money flow is falling.
The index ranges between 2915 and 3050, forming a base. A break out of the base will signal a primary trend change to an up-trend. Look for volume confirmation.
Slow Stochastic (20,3,3) has crossed to above its signal line; MACD (26,12,9) is above; Twiggs money flow is falling.
Perpetual Trustees [PPT]
Last covered on
September 24, 2002.
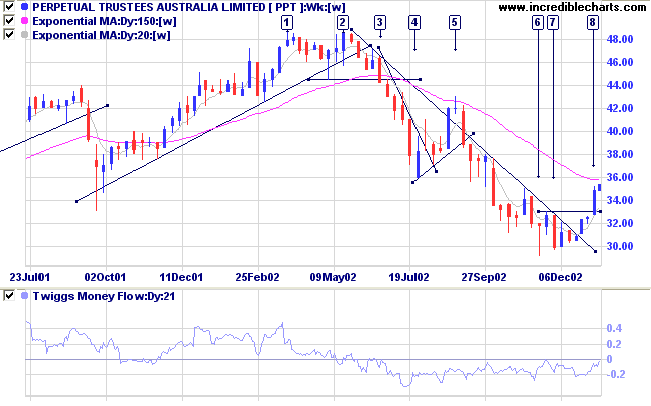
Another stock from the Diversified Financial Services sector, PPT formed a double top at [1] and [2] before a stage 4 down-trend. There was a strong reversal from [4] to [5] before the down-trend resumed and the stock fell to 30.00. PPT now appears to have bottomed at [6], breaking the long-term trend-line in December and rising above the previous high at [8].
Relative strength (price ratio: xao) is rising and MACD has completed a bullish divergence. But Twiggs money flow still signals weakness, failing to cross above zero.
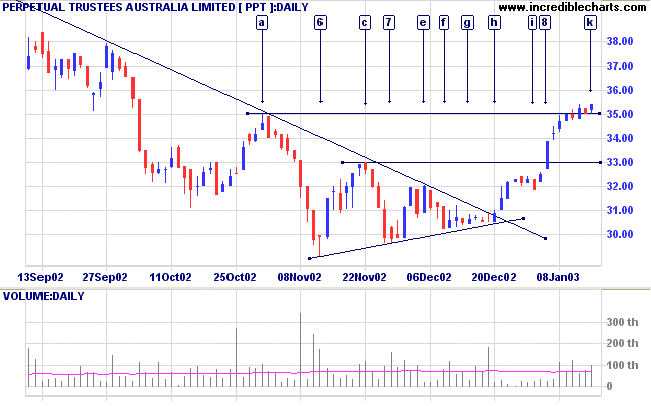
The daily chart shows that the bottom formed a symmetrical
triangle from [a] to [h]. Volume declined on each successive
trough;[6], [7] and [f]; but failed to surge on any of the
rallies. The breakout at [h] showed very low volume and so has
the break above resistance at [8]. The stock is now entering
congestion at [k].
An unconvincing reversal:
- The base is narrow;
- There was no volume confirmation within the triangle pattern;
- Low volume on the breakout; and
- No real increase in volume on the rally.
The breakout has a fairly high probability of failure, with PPT
likely to re-test support at 30.00 and build a broader base.
Market strategy
For further guidance see Understanding the Trading Diary.
For further guidance see Understanding the Trading Diary.
Short-term: Long if the All Ords rises above 3060. The Slow
Stochastic and MACD are above their respective signal lines.
Medium-term: Avoid new entries.
Long-term: Wait for confirmation of the
bottom reversal signal.
Colin Twiggs
Less is more.
- An interesting paradox that applies to technical analysis as well as to many other fields.
Too much analysis leads to paralysis.
- An interesting paradox that applies to technical analysis as well as to many other fields.
Too much analysis leads to paralysis.
Back Issues
Click here to access the
Trading Diary Archives.
Back Issues
Access the Trading Diary Archives.

Author: Colin Twiggs is a former investment banker with almost 40 years of experience in financial markets. He co-founded Incredible Charts and writes the popular Trading Diary and Patient Investor newsletters.
Using a top-down approach, Colin identifies key macro trends in the global economy before evaluating selected opportunities using a combination of fundamental and technical analysis.
Focusing on interest rates and financial market liquidity as primary drivers of the economic cycle, he warned of the 2008/2009 and 2020 bear markets well ahead of actual events.
He founded PVT Capital (AFSL No. 546090) in May 2023, which offers investment strategy and advice to wholesale clients.