The index is forming a base between 7500 and 9130.
The primary trend is down and will only reverse up if the average rises above 9076 (the high from December 02).
The Nasdaq Composite fell 2.1% to 1401.
The primary trend is up.
The S&P 500 closed 13 points down at 909.
The index ranges between 965 and 768, establishing a base.
All three indices have failed to re-test support at their 6-month lows, a bullish sign.
The Chartcraft NYSE Bullish % Indicator increased to 52% (January 07).
Alcoa has been hurt by lower aluminum prices, reporting a fourth-quarter loss after restructuring charges. (more)
Intel sees flat sales
Intel does not foresee any increase in technology spending in the next 6 months.
Gold
New York: Spot gold is up 640 cents at $US 353.30.
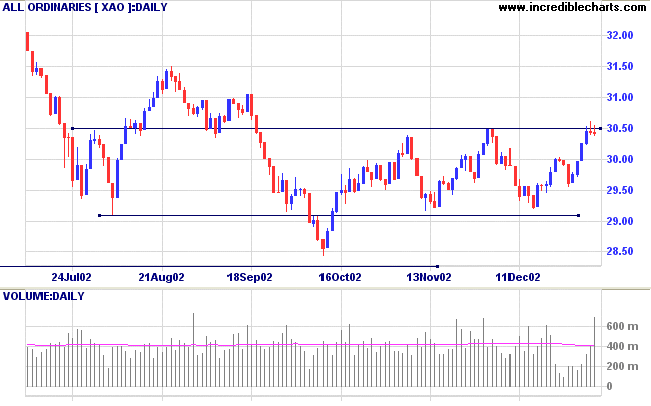
The index ranges between 2915 and 3050, forming a base. A break above 3050 will signal a primary trend change to an up-trend. Look for volume confirmation.
Slow Stochastic (20,3,3) is above its signal line; MACD (26,12,9) is above; Twiggs money flow is falling.

For further guidance see Understanding the Trading Diary.
- John Powell
Back Issues

Author: Colin Twiggs is a former investment banker with almost 40 years of experience in financial markets. He co-founded Incredible Charts and writes the popular Trading Diary and Patient Investor newsletters.
Using a top-down approach, Colin identifies key macro trends in the global economy before evaluating selected opportunities using a combination of fundamental and technical analysis.
Focusing on interest rates and financial market liquidity as primary drivers of the economic cycle, he warned of the 2008/2009 and 2020 bear markets well ahead of actual events.
He founded PVT Capital (AFSL No. 546090) in May 2023, which offers investment strategy and advice to wholesale clients.
