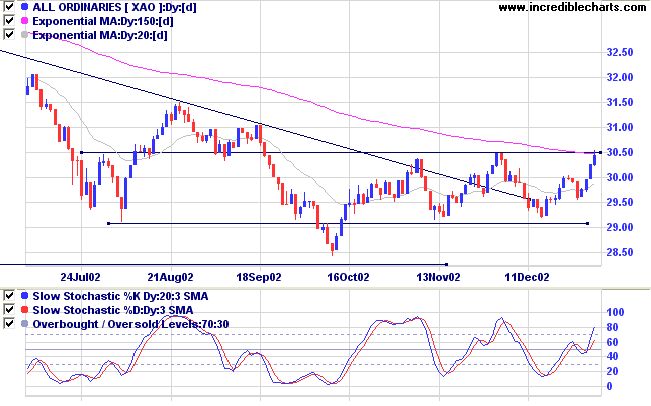
The index is headed for a re-test of resistance at the upper limit of the 7500 to 9130 base.
The primary trend is down and will only reverse up if the average rises above 9076 (the high from December 02).
The Nasdaq Composite rallied 2.5% to close at 1421.
The primary trend is up.
The S&P 500 is up 20 points at 929.
The index is ranging between 965 and 768, establishing a base.
All three indices have failed to re-test support at their 6-month lows, a bullish sign.
The Chartcraft NYSE Bullish % Indicator appears stuck at 50% (January 03).
Economists are divided about whether the proposed stimulus package will work. (more)
Gold
New York: After an intra-day high of $US 356.00 spot gold is back at $US 350.70.
A break above this level will signal a primary trend change to an up-trend; the last correction taking the form of a line. Look for volume confirmation.
Slow Stochastic (20,3,3) is above its signal line; MACD (26,12,9) is above; Twiggs money flow is rising, signaling accumulation.

For further guidance see Understanding the Trading Diary.
- The Analects of Confucius
Back Issues

Author: Colin Twiggs is a former investment banker with almost 40 years of experience in financial markets. He co-founded Incredible Charts and writes the popular Trading Diary and Patient Investor newsletters.
Using a top-down approach, Colin identifies key macro trends in the global economy before evaluating selected opportunities using a combination of fundamental and technical analysis.
Focusing on interest rates and financial market liquidity as primary drivers of the economic cycle, he warned of the 2008/2009 and 2020 bear markets well ahead of actual events.
He founded PVT Capital (AFSL No. 546090) in May 2023, which offers investment strategy and advice to wholesale clients.
