We want to thank existing members for their support and offer a reduced subscription to all
who subscribe by 15 February 2003.
The reduced subscription is $180 for the year (or $18 per month). Normal subscription will be $270 (or $27 per month).
There will be a free trial period for all members to evaluate the new services.
Please give us your feedback and suggestions
at the Chart
Forum.
Trading Diary
December 18, 2002
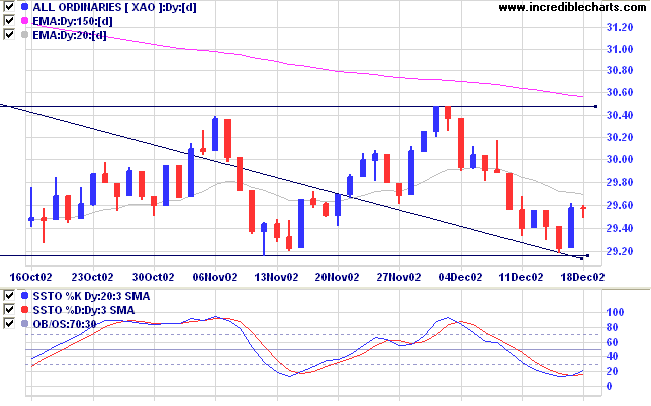
The primary trend is down and will only reverse up if the average rises above 9130.
The Nasdaq Composite gapped down at the opening, falling 2.2% to 1361.
The primary trend is up.
The S&P 500 lost 11 points to close at 891.
The primary trend is down.
The Chartcraft NYSE Bullish % Indicator appears stuck at 50% (December 16).
President Bush expresses concerns about omissions in the Iraqi arms declaration.
Gold
New York: Spot gold is up more than 700 cents at $US 344.10.
The Slow Stochastic (20,3,3) has crossed to above its signal line; MACD (26,12,9) is below. Twiggs money flow is just above zero.

Last covered on November 8.
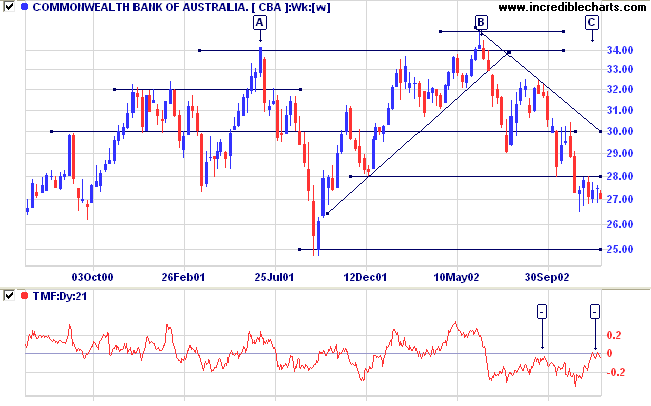
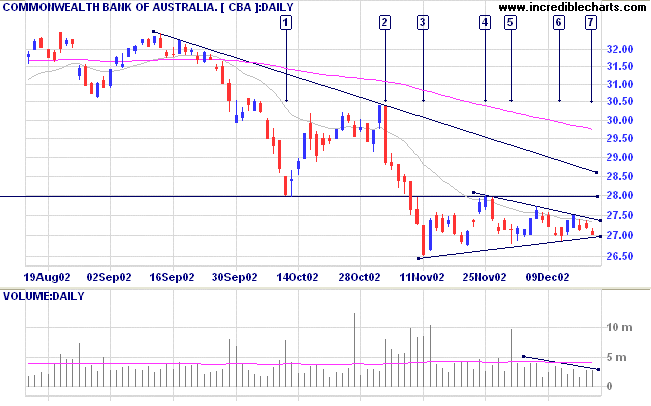
Relative strength (price ratio: xao) and MACD are bearish. Twiggs Money Flow continues to signal distribution.


The next major support level is at 25.00.
For further guidance see Understanding the Trading Diary.
and it will spill.
Keep sharpening your knife
and it will blunt.
Chase after money and security
and your heart will never unclench.
Seek people's approval
and you will be their prisoner.
Do your work, then step back.
The only path to serenity.
- Lao Tse
Back Issues

Author: Colin Twiggs is a former investment banker with almost 40 years of experience in financial markets. He co-founded Incredible Charts and writes the popular Trading Diary and Patient Investor newsletters.
Using a top-down approach, Colin identifies key macro trends in the global economy before evaluating selected opportunities using a combination of fundamental and technical analysis.
Focusing on interest rates and financial market liquidity as primary drivers of the economic cycle, he warned of the 2008/2009 and 2020 bear markets well ahead of actual events.
He founded PVT Capital (AFSL No. 546090) in May 2023, which offers investment strategy and advice to wholesale clients.
