December holidays
The newsletter over the holiday season will be shorter, with fewer stocks covered,
as we take a break from the market.
Trading Diary
December 12, 2002
These extracts from my daily trading diary are
intended to illustrate the techniques used in short-term trading
and should not be interpreted as investment advice. Full terms
and conditions can be found at Terms
of Use .
USA
The Dow formed a further inside day, closing
down 0.6% at 8567 on average volume. This signals
uncertainty.
If the next rally fails to take out the high from December 2, we may face a re-test of the 7500 and 7200 support levels; equal highs (August 22 and December 2) in a down-trend are a bearish signal.
The primary trend is down. It will reverse up if the average rises above 9130.
The Nasdaq Composite gained 0.2% to close at 1399.
The primary trend is up.
The S&P 500 closed down 3 points at 901, forming an inside day.
The index formed two equal highs, on August 22 and December 2, and appears set to test the October low of 768.
The primary trend is down.
The Chartcraft NYSE Bullish % Indicator signals a bull alert at 50% (December 11).
The equal highs forming the ascending triangle are at [1] and [4] on the daily chart. The break below the lower border of the ascending triangle is on strong volume at [5]. The counter-trend at [6] is of short duration and on low volume, signaling a strong down-trend.
A break below 11.81, the low at [2], will be a strong bear signal, with a likely re-test of the 11.00 support level. A break above resistance at 13.35 would be a strong bull signal.
Back Issues
If the next rally fails to take out the high from December 2, we may face a re-test of the 7500 and 7200 support levels; equal highs (August 22 and December 2) in a down-trend are a bearish signal.
The primary trend is down. It will reverse up if the average rises above 9130.
The Nasdaq Composite gained 0.2% to close at 1399.
The primary trend is up.
The S&P 500 closed down 3 points at 901, forming an inside day.
The index formed two equal highs, on August 22 and December 2, and appears set to test the October low of 768.
The primary trend is down.
The Chartcraft NYSE Bullish % Indicator signals a bull alert at 50% (December 11).
Tension in Iraq fuels gold rise
The US government received a credible report that groups linked to al Qaeda in Iraq, have acquired a chemical weapon.
Gold
New York: Spot gold jumped a massive 640 cents to $US 331.30, above the five-year high of $327.05 from May this year.
The US government received a credible report that groups linked to al Qaeda in Iraq, have acquired a chemical weapon.
Gold
New York: Spot gold jumped a massive 640 cents to $US 331.30, above the five-year high of $327.05 from May this year.
ASX Australia
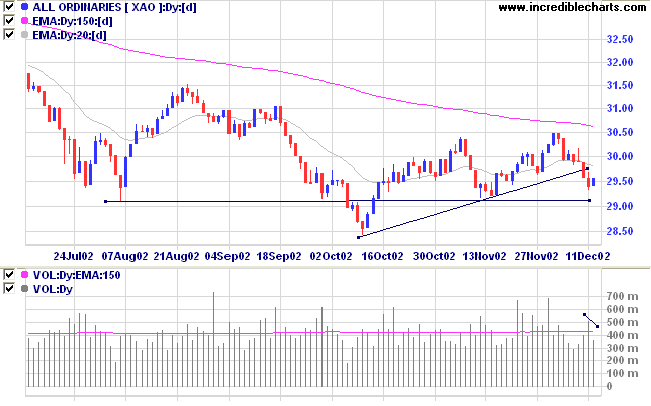
The All Ordinaries formed an inside day on lower volume, while
closing up 17 points at 2956. In a strong down-trend this acts
as a continuation signal. The index appears set to test support
at 2915 in the next few days.
MACD (26,12,9) and Slow Stochastic (20,3,3) are below their signal lines; Twiggs money flow is just above zero.
MACD (26,12,9) and Slow Stochastic (20,3,3) are below their signal lines; Twiggs money flow is just above zero.
AMP Limited [AMP]
Last covered on August 22.
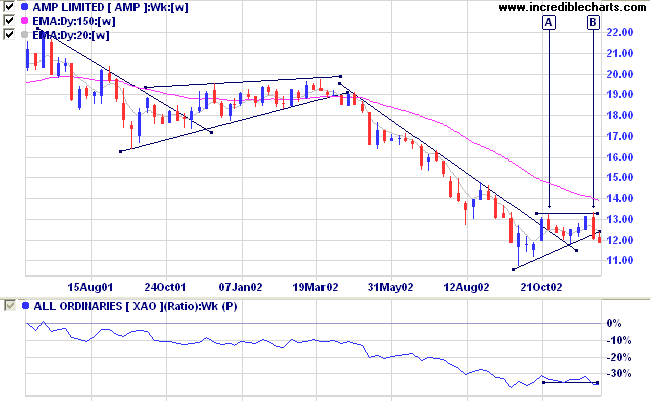
In 2001 AMP started to trend downwards after a high of 22.00. This was followed by a period of consolidation in the form of a bearish rising wedge. The wedge broke into a fast down-trend, ending at 11.00, 50% of the earlier high. The break above the trendline in October signaled that the down-trend had slowed. Two equal highs at [A] and [B] then formed a bullish ascending triangle, but price has broken below the newly established upward trendline.
Relative Strength (price ratio: xao) and Twiggs money flow are falling, while MACD is neutral.
Last covered on August 22.
In 2001 AMP started to trend downwards after a high of 22.00. This was followed by a period of consolidation in the form of a bearish rising wedge. The wedge broke into a fast down-trend, ending at 11.00, 50% of the earlier high. The break above the trendline in October signaled that the down-trend had slowed. Two equal highs at [A] and [B] then formed a bullish ascending triangle, but price has broken below the newly established upward trendline.
Relative Strength (price ratio: xao) and Twiggs money flow are falling, while MACD is neutral.
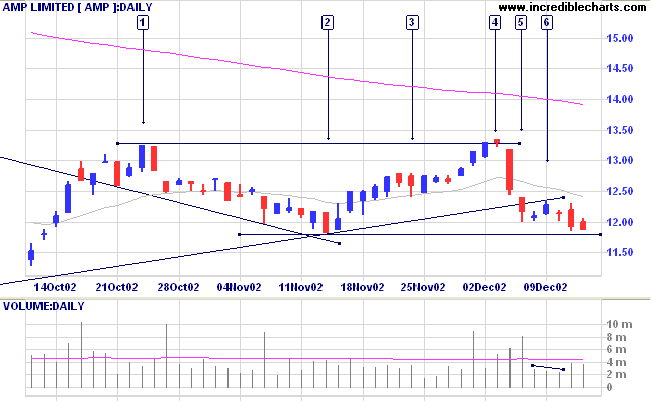
The equal highs forming the ascending triangle are at [1] and [4] on the daily chart. The break below the lower border of the ascending triangle is on strong volume at [5]. The counter-trend at [6] is of short duration and on low volume, signaling a strong down-trend.
A break below 11.81, the low at [2], will be a strong bear signal, with a likely re-test of the 11.00 support level. A break above resistance at 13.35 would be a strong bull signal.
Market strategy
For further guidance see Understanding the Trading Diary.
For further guidance see Understanding the Trading Diary.
Short-term: Short. The Slow Stochastic and MACD are below their
respective signal lines.
Medium-term: Avoid new entries.
Long-term: Wait for confirmation of the
bottom reversal signal.
Colin Twiggs
You cannot know in advance the results of any given
trade,
you have to think in terms of a series of probabilities.
- Mark Douglas: Trading in the Zone
you have to think in terms of a series of probabilities.
- Mark Douglas: Trading in the Zone
Back Issues
Click here to access the
Trading Diary Archives.
Back Issues
Access the Trading Diary Archives.

Author: Colin Twiggs is a former investment banker with almost 40 years of experience in financial markets. He co-founded Incredible Charts and writes the popular Trading Diary and Patient Investor newsletters.
Using a top-down approach, Colin identifies key macro trends in the global economy before evaluating selected opportunities using a combination of fundamental and technical analysis.
Focusing on interest rates and financial market liquidity as primary drivers of the economic cycle, he warned of the 2008/2009 and 2020 bear markets well ahead of actual events.
He founded PVT Capital (AFSL No. 546090) in May 2023, which offers investment strategy and advice to wholesale clients.