December holidays
The newsletter over the holiday season will be shorter, with fewer stocks covered
as we take a break from the pressures of the market.
Trading Diary
December 11, 2002
These extracts from my daily trading diary are
intended to illustrate the techniques used in short-term trading
and should not be interpreted as investment advice. Full terms
and conditions can be found at Terms
of Use .
USA
The Dow formed another inside day, closing
almost unchanged at 8589 on average volume. The inside day
signals indecision about the future direction of the
market.
If the next rally fails to take out the high from December 2, we may face a re-test of the 7500 and 7200 support levels; equal highs (August 22 and December 2) in a down-trend are a bearish signal.
The primary trend is down. It will reverse up if the average rises above 9130.
The Nasdaq Composite gained 0.4% to close at 1396.
The primary trend is up.
The S&P 500 closed unchanged at 904. The index formed two equal highs (August 22 and December 2) and appears set to test the October low of 768.
The primary trend is down.
The Chartcraft NYSE Bullish % Indicator signals a bull alert at 50% (December 10).
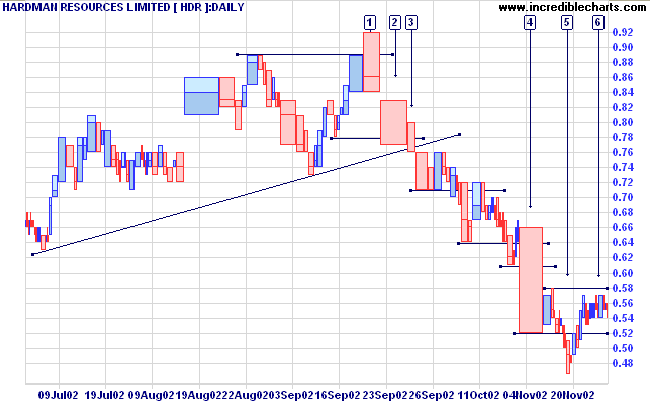
A false break of resistance at [1] is an early indication that the trend may reverse, reinforced by the gap at [2] on strong volume. The breakout from the trend channel occurred at [3] and was followed by a creeping down-trend before a fast break at [4] with strong volume. The trend continued down to [5] but on far lighter volume and the counter-trend has climbed back to re-test resistance at 0.58, the high of the previous up-swing. The resistance level appears to be holding, with price fluctuating in a narrow band.
A break below 0.52 will be a strong bear signal. A break above 0.58 would be mildly bullish.
Back Issues
If the next rally fails to take out the high from December 2, we may face a re-test of the 7500 and 7200 support levels; equal highs (August 22 and December 2) in a down-trend are a bearish signal.
The primary trend is down. It will reverse up if the average rises above 9130.
The Nasdaq Composite gained 0.4% to close at 1396.
The primary trend is up.
The S&P 500 closed unchanged at 904. The index formed two equal highs (August 22 and December 2) and appears set to test the October low of 768.
The primary trend is down.
The Chartcraft NYSE Bullish % Indicator signals a bull alert at 50% (December 10).
Procter & Gamble
The consumer products manufacturer raised its earnings forecast for the quarter, citing strong sales in its health care business and in overseas markets. (more)
Gold
New York: Spot gold gained 170 cents to $US 324.90.
The consumer products manufacturer raised its earnings forecast for the quarter, citing strong sales in its health care business and in overseas markets. (more)
Gold
New York: Spot gold gained 170 cents to $US 324.90.
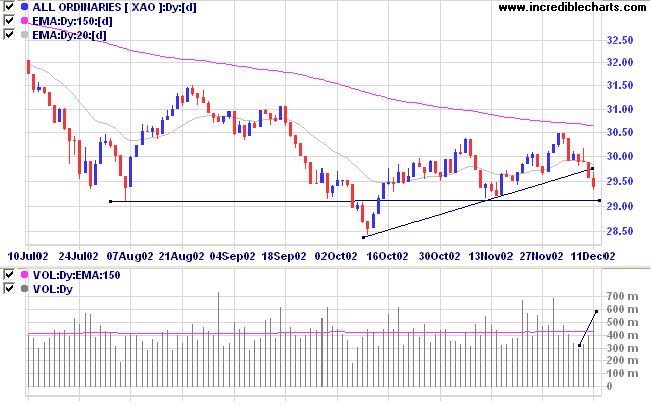
ASX Australia
The All Ordinaries closed down a further 17 points at 2939 on
rising volume. The index appears set to test support at 2915 in
the next few days
MACD (26,12,9) and Slow Stochastic (20,3,3) are below their signal lines; Twiggs money flow signals distribution.
MACD (26,12,9) and Slow Stochastic (20,3,3) are below their signal lines; Twiggs money flow signals distribution.
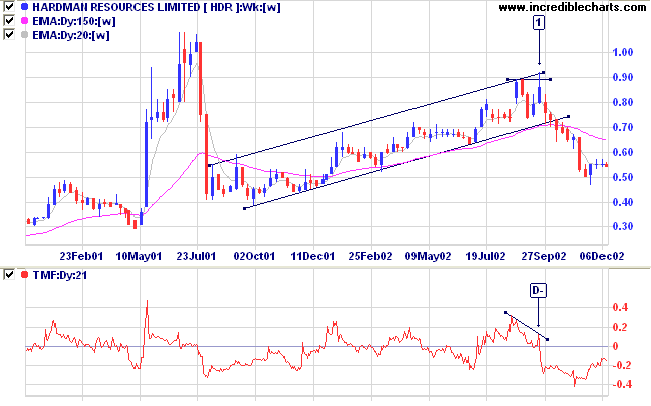
Hardman Resources [HDR]
Last covered on September 3.
After a huge spike in 2001, HDR continued in an upward trend until a false break above the previous high at [1], accompanied by a bearish divergence on Twiggs money flow and MACD and falling Relative Strength (price ratio: xao). The stock started a strong down-trend after breaking below the trend channel but is now forming a sideways congestion pattern.
A false break of resistance at [1] is an early indication that the trend may reverse, reinforced by the gap at [2] on strong volume. The breakout from the trend channel occurred at [3] and was followed by a creeping down-trend before a fast break at [4] with strong volume. The trend continued down to [5] but on far lighter volume and the counter-trend has climbed back to re-test resistance at 0.58, the high of the previous up-swing. The resistance level appears to be holding, with price fluctuating in a narrow band.
A break below 0.52 will be a strong bear signal. A break above 0.58 would be mildly bullish.
Market strategy
For further guidance see Understanding the Trading Diary.
For further guidance see Understanding the Trading Diary.
Short-term: Short. The Slow Stochastic and MACD are below their
respective signal lines.
Medium-term: Avoid new entries.
Long-term: Wait for confirmation of the
bottom reversal signal.
Colin Twiggs
It is not given to any man to know it all.
When he thinks he's the smartest man in the world,
he puts himself in a class we call fools.
- Roy Longstreet: Viewpoints of a Commodity Trader.
When he thinks he's the smartest man in the world,
he puts himself in a class we call fools.
- Roy Longstreet: Viewpoints of a Commodity Trader.
Back Issues
Click here to access the
Trading Diary Archives.
Back Issues
Access the Trading Diary Archives.

Author: Colin Twiggs is a former investment banker with almost 40 years of experience in financial markets. He co-founded Incredible Charts and writes the popular Trading Diary and Patient Investor newsletters.
Using a top-down approach, Colin identifies key macro trends in the global economy before evaluating selected opportunities using a combination of fundamental and technical analysis.
Focusing on interest rates and financial market liquidity as primary drivers of the economic cycle, he warned of the 2008/2009 and 2020 bear markets well ahead of actual events.
He founded PVT Capital (AFSL No. 546090) in May 2023, which offers investment strategy and advice to wholesale clients.