December holidays
The newsletter over the holiday season will be shorter, with fewer stocks covered
as we take a break from the pressures of the market.
Trading Diary
December 10, 2002
These extracts from my daily trading diary are
intended to illustrate the techniques used in short-term trading
and should not be interpreted as investment advice. Full terms
and conditions can be found at Terms
of Use .
USA
The Dow formed an inside day, up 1.2% at 8574 on
average volume. The inside day signals indecision about the
future direction of the market. If the next rally fails to take
out the high from December 2, we may face a re-test of the 7500
and 7200 support levels; equal highs (August 22 and December 2)
in a down-trend are a bearish signal.
The primary trend is still down. It will reverse up if the average rises above 9130.
The Nasdaq Composite formed an inside day, up 1.7% at 1390.
The primary trend is up.
The S&P 500 gained 12 points to close at 904, also on an inside day.
The primary trend will complete a double bottom reversal if it rises above 965.
The Chartcraft NYSE Bullish % Indicator signals a bull alert at 50% (December 06).
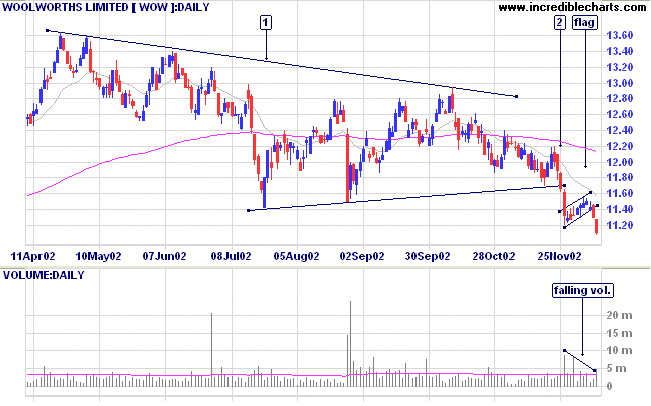
After a breakout from the triangle on strong volume, price then formed a flag pattern with declining volume and a tight range. The break down from the flag pattern was an ideal entry point for short-term traders who did not enter at [2]: the flag failed to reach the low of the previous trough, signaling a fast down-trend and volume has increased on the breakout. Stops should be placed just above the high of the flag, which was 11.55.
The target for the triangle breakout is 9.83 (11.71 - (13.29 - 11.41)), measured vertically from the low at [1] to the opposite border of the triangle.
Back Issues
The primary trend is still down. It will reverse up if the average rises above 9130.
The Nasdaq Composite formed an inside day, up 1.7% at 1390.
The primary trend is up.
The S&P 500 gained 12 points to close at 904, also on an inside day.
The primary trend will complete a double bottom reversal if it rises above 965.
The Chartcraft NYSE Bullish % Indicator signals a bull alert at 50% (December 06).
Fed leaves rates unchanged
At their last meeting of the year, the Federal Reserve Board left overnight bank lending rates unchanged at 1.25%. (more)
Gold
New York: Spot gold fell 280 cents to $US 323.20.
At their last meeting of the year, the Federal Reserve Board left overnight bank lending rates unchanged at 1.25%. (more)
Gold
New York: Spot gold fell 280 cents to $US 323.20.
ASX Australia
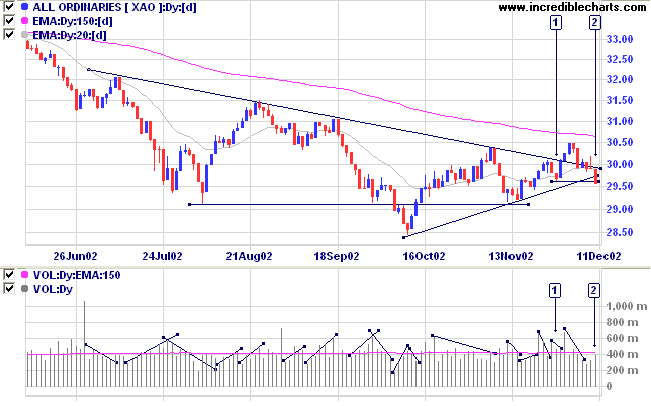
The All Ordinaries fell sharply to 2956 on higher volume,
breaking below the previous low at [1] and ending the creeping
up-trend.
The primary trend will reverse (up) if the index rises above 3150.
MACD (26,12,9) and Slow Stochastic (20,3,3) are below their signal lines; Twiggs money flow is falling.
The primary trend will reverse (up) if the index rises above 3150.
MACD (26,12,9) and Slow Stochastic (20,3,3) are below their signal lines; Twiggs money flow is falling.
Woolworths [WOW]
Last covered on November 29.
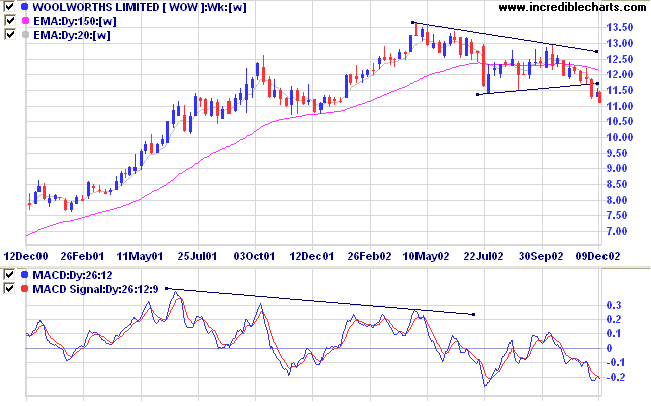
WOW entered a down trend after forming a stage 3 top in the shape of a symmetrical triangle, completed by a breakout below the base of the triangle at the end of November.
Relative strength (price ratio: xao) and Twiggs money flow are falling, while MACD has shown bearish divergences since October 2001.
Last covered on November 29.
WOW entered a down trend after forming a stage 3 top in the shape of a symmetrical triangle, completed by a breakout below the base of the triangle at the end of November.
Relative strength (price ratio: xao) and Twiggs money flow are falling, while MACD has shown bearish divergences since October 2001.
After a breakout from the triangle on strong volume, price then formed a flag pattern with declining volume and a tight range. The break down from the flag pattern was an ideal entry point for short-term traders who did not enter at [2]: the flag failed to reach the low of the previous trough, signaling a fast down-trend and volume has increased on the breakout. Stops should be placed just above the high of the flag, which was 11.55.
The target for the triangle breakout is 9.83 (11.71 - (13.29 - 11.41)), measured vertically from the low at [1] to the opposite border of the triangle.
Market strategy
For further guidance see Understanding the Trading Diary.
For further guidance see Understanding the Trading Diary.
Short-term: Short. The Slow Stochastic and MACD are below their
respective signal lines.
Medium-term: Avoid new entries.
Long-term: Wait for confirmation of the
bottom reversal signal.
Colin Twiggs
To live content with small means;
to seek elegance rather than luxury,
and refinement rather than fashion;
to be worthy, not respectable, and wealthy, not, rich;
to listen to stars and birds, babes and sages, with open heart;
to study hard;
to think quietly, act frankly, talk gently, await occasions, hurry never;
in a word, to let the spiritual, unbidden and unconscious,
grow up through the common - this is my symphony.
- William Henry Channing (1810 - 1884).
Back Issues
Click here to access the
Trading Diary Archives.
Back Issues
Access the Trading Diary Archives.

Author: Colin Twiggs is a former investment banker with almost 40 years of experience in financial markets. He co-founded Incredible Charts and writes the popular Trading Diary and Patient Investor newsletters.
Using a top-down approach, Colin identifies key macro trends in the global economy before evaluating selected opportunities using a combination of fundamental and technical analysis.
Focusing on interest rates and financial market liquidity as primary drivers of the economic cycle, he warned of the 2008/2009 and 2020 bear markets well ahead of actual events.
He founded PVT Capital (AFSL No. 546090) in May 2023, which offers investment strategy and advice to wholesale clients.