When replying to a private message received from the Chart Forum,
do not use the normal Reply button in your email toolbar.
-
Click on the link below the message:
"If you would like to reply to this message by sending a private message........."
-
Otherwise the email is sent to the forum
administrator.
Trading Diary
December 06, 2002
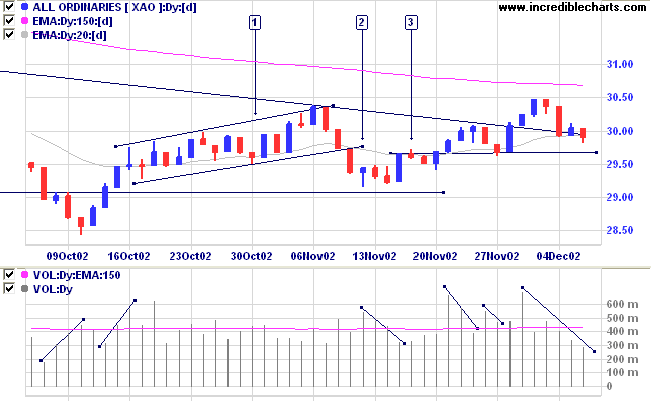
The primary trend is still down. It will reverse up if the average rises above 9130.
The Nasdaq Composite formed a closing price reversal, gaining 0.8% to close at 1422.
The primary trend is up (the index is above 1426).
The S&P 500 closed up 6 points at 912.
The primary trend will complete a double bottom reversal if it rises above 965.
The Chartcraft NYSE Bullish % Indicator signals a bull alert at 50% (December 04).
The jobless rate reached 6% in November after a slight decline to 5.7% in October. (more)
Gold
New York: Spot gold continues to rise, up 150 cents at $US 325.90.
The primary trend will reverse (up) if the index rises above 3150.
The Slow Stochastic (20,3,3) is below its signal line; MACD (26,12,9) is above; Twiggs money flow signals accumulation.

Last covered on October 11.
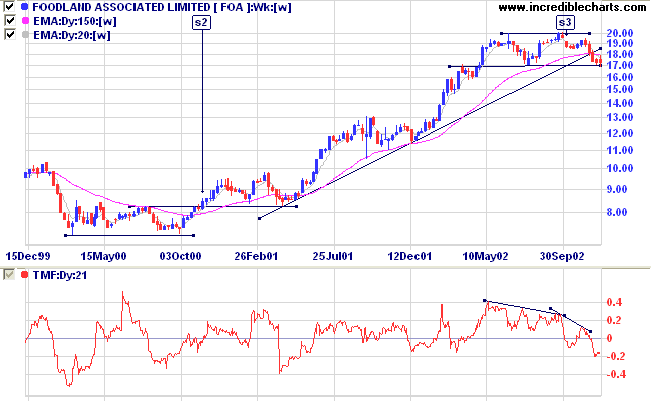
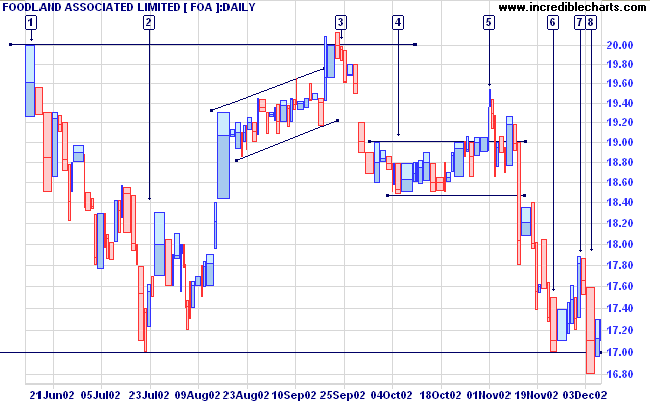
FOA has formed a stage 3 top after a strong stage 2 up-trend. Price has formed two equal highs in June and September and is now testing support at the July low of 17.00
Relative strength (price ratio: xao) is falling, MACD shows a bearish divergence and Twiggs money flow signals distribution.


Changes are highlighted in bold.
- Energy [XEJ] - stage 4 (RS is falling)
- Materials [XMJ] - stage 2 (RS is rising)
- Industrials [XNJ] - stage 4 (RS is falling)
- Consumer Discretionary [XDJ] - stage 2 (RS is rising)
- Consumer Staples [XSJ] - stage 4 (RS is falling)
- Health Care [XHJ] - stage 1 (RS is level)
- Property Trusts [XPJ] - stage 3 (RS is level)
- Financial excl. Property Trusts [XXJ] - stage 4 (RS is falling)
- Information Technology [XIJ] - stage 4 (RS is falling)
- Telecom Services [XTJ] - stage 4 (RS is falling)
- Utilities [XUJ] - stage 2 (RS is level)
A stock screen of the ASX 200 using % Price Move (1 month: +5%) returned 24 stocks (compared to 99, August 23rd and 10 on October 4th). Notable sectors are:
- Pharmaceuticals
For further guidance see Understanding the Trading Diary.
is more important than any other one thing.
- Abraham Lincoln
Back Issues

Author: Colin Twiggs is a former investment banker with almost 40 years of experience in financial markets. He co-founded Incredible Charts and writes the popular Trading Diary and Patient Investor newsletters.
Using a top-down approach, Colin identifies key macro trends in the global economy before evaluating selected opportunities using a combination of fundamental and technical analysis.
Focusing on interest rates and financial market liquidity as primary drivers of the economic cycle, he warned of the 2008/2009 and 2020 bear markets well ahead of actual events.
He founded PVT Capital (AFSL No. 546090) in May 2023, which offers investment strategy and advice to wholesale clients.
