When replying to a private message received from the Chart Forum:
-
Click on the link below the message:
If you would like to reply to this message by sending a private message of your own through the discussion board, use the following link to send your reply:
https://forum.incrediblecharts.com/userscripts/forums/board-profile.plx?action=sendmsg&to=colin_twiggs&db=1
-
Do not use the normal Reply button in
your Email program - this would reply to the forum mail
server.
Trading Diary
December 03, 2002
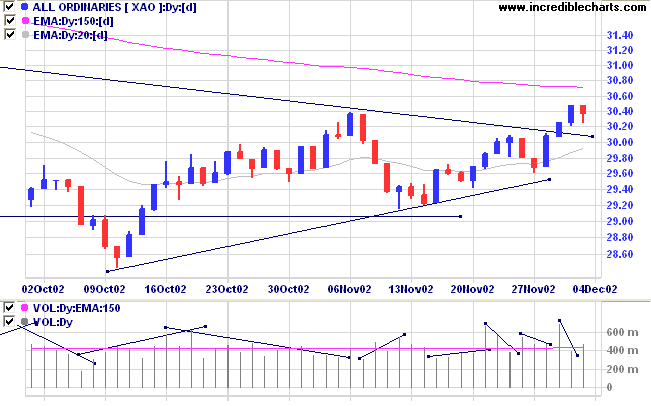
The Nasdaq Composite index gapped down 2.4% to close at 1448.
The primary trend is up.
The S&P 500 closed down 14 points at 920.
The Chartcraft NYSE Bullish % Indicator signals a bull alert at 50% (December 02).
AOL Online expects declining advertising and sales revenues for 2003. (more)
Gold
New York: Spot gold is up 290 cents to $US 320.40.
The primary trend will reverse (up) if the index rises above 3150.
The Slow Stochastic (20,3,3) is above its signal line; MACD (26,12,9) is above; Twiggs money flow signals accumulation.

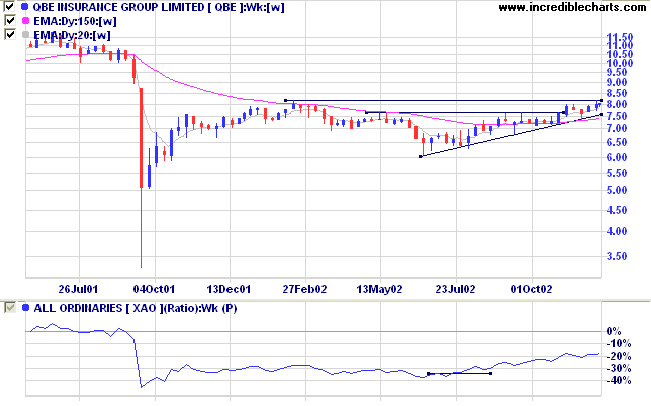
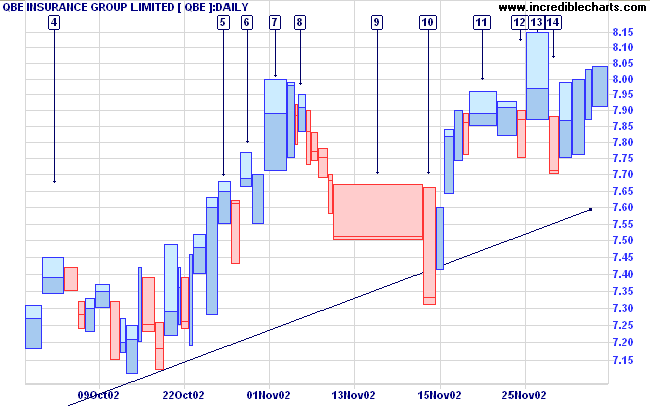
After a sharp fall in 2001, QBE has formed an ascending triangle with the upper border at 8.15. Relative strength (price ratio: xao) is rising, as are Twiggs money flow and MACD.

If there is a breakout, the target is 10.25 (8.15 + 8.15 - 6.05).

For further guidance see Understanding the Trading Diary.
not to trade often.
- Alexander Elder.
Back Issues

Author: Colin Twiggs is a former investment banker with almost 40 years of experience in financial markets. He co-founded Incredible Charts and writes the popular Trading Diary and Patient Investor newsletters.
Using a top-down approach, Colin identifies key macro trends in the global economy before evaluating selected opportunities using a combination of fundamental and technical analysis.
Focusing on interest rates and financial market liquidity as primary drivers of the economic cycle, he warned of the 2008/2009 and 2020 bear markets well ahead of actual events.
He founded PVT Capital (AFSL No. 546090) in May 2023, which offers investment strategy and advice to wholesale clients.
