When you reply to a private message received from the Chart Forum:
-
Click on the link below the message:
If you would like to reply to this message by sending a private message of your own through the discussion board, use the following link to send your reply:
https://forum.incrediblecharts.com/userscripts/forums/board-profile.plx?action=sendmsg&to=colin_twiggs&db=1
-
Do not use the normal Reply button in
your Email program
Trading Diary
December 02, 2002
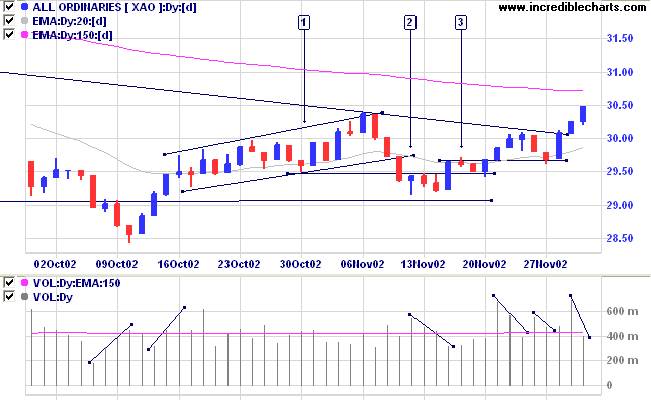
The Nasdaq Composite index also formed an outside day, closing up 0.4% at 1484.
The S&P 500 formed an outside day, closing almost unchanged at 934.
The Chartcraft NYSE Bullish % Indicator signals a bull alert at 50% (November 29).
The Institute for Supply Management index of business activity came in at 49.2 for November. A rise above 50 would signify manufacturing growth.
Gold
New York: Spot gold declined 120 cents to $US 317.50.
The primary trend will reverse if the index rises above 3150.
The Slow Stochastic (20,3,3) is above its signal line; MACD (26,12,9) is above; Twiggs money flow signals accumulation.

Last covered on November 29.
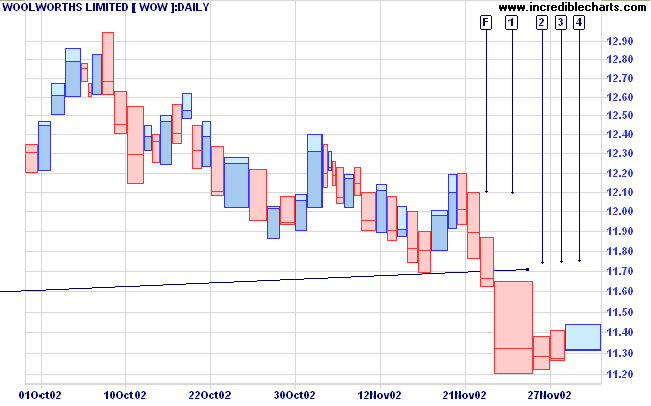
I did not make myself very clear: If price reverses downwards after [4], below the previous low at 11.70, this will be a strong bear signal.

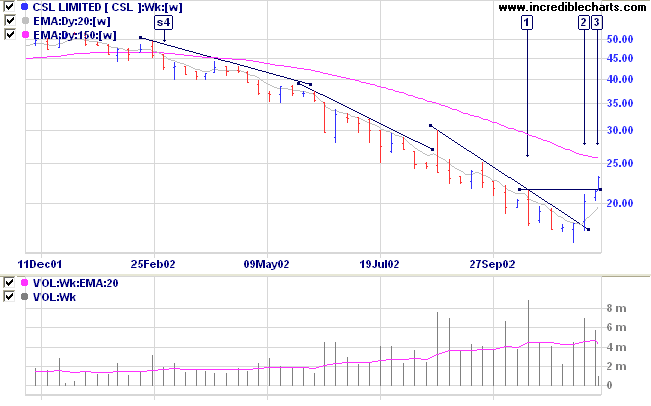
CSL has been in a stage 4 down-trend for the last 9 months before breaking the trendline at [2] and rallying sharply to above the last high [1] in the down-trend. Relative strength (price ratio: xao) is rising.
The rally to [3] appears to be a sharp "V" reversal. These are unreliable patterns, often resolving as counter-trends which fade to re-test the previous lows, and are unreliable to trade (in medium/long-term).

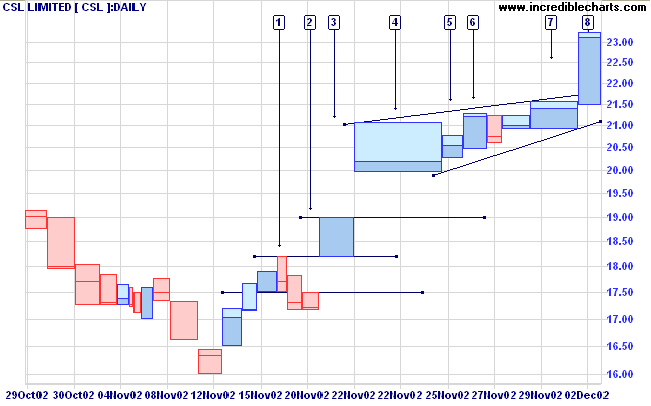
The breakout from the flag at [8] has a target of 24.50 (21.75 + 21.00 - 18.25). Entry has to be taken close to the breakout point in order to keep the stop-loss (below [7]) within reasonable limits.

For further guidance see Understanding the Trading Diary.
because they come to wisdom through failure.
- William Saroyan.
Back Issues

Author: Colin Twiggs is a former investment banker with almost 40 years of experience in financial markets. He co-founded Incredible Charts and writes the popular Trading Diary and Patient Investor newsletters.
Using a top-down approach, Colin identifies key macro trends in the global economy before evaluating selected opportunities using a combination of fundamental and technical analysis.
Focusing on interest rates and financial market liquidity as primary drivers of the economic cycle, he warned of the 2008/2009 and 2020 bear markets well ahead of actual events.
He founded PVT Capital (AFSL No. 546090) in May 2023, which offers investment strategy and advice to wholesale clients.
