Chart Forum: Posting Images
A number of members have difficulty posting chart images to the forum. Here is a brief guide:
1. Use File >> Save Chart As Image to save the chart as a PNG image (suggested size: 651 x 406 pixels).
2. Save the image to your desktop or a convenient folder.
3. At the end of your posting to the Chart Forum, type \image{name}
For convenience, use the stock code as the name, eg. \image{XAO}
The name does not have to match the filename from 2.
4. Preview your posting and a box will be displayed showing the position of the image.
5. Save and you are prompted for the location of the chart image.
Use the Browse button to locate the image from 2.
Trading Diary
November 27, 2002
These extracts from my daily trading diary are
intended to illustrate the techniques used in short-term trading
and should not be interpreted as investment advice. Full terms
and conditions can be found at Terms
of Use .
USA
The Dow rallied 2.9% to 8931 on lower volume.
The trend appears to be strengthening, with the latest low
closing above the previous high, but lower volume still signals
weakness.
The primary trend will reverse (up) if the index rises above 9130.
The Nasdaq Composite Index gained 3% to close at 1487. The trend is strong, with the latest low well above the previous high.
The primary trend is up.
The S&P 500 gained 25 points to close at 938.
The primary trend will complete a double bottom reversal if it rises above 965.
The Chartcraft NYSE Bullish % Indicator signals a bull alert at 48% (November 25).
Better economic news
Job cuts are falling, although there is no sign yet of new hiring. Personal spending increased by 0.4% in October and durable goods orders are rising. But heavy capital spending is still down: airlines are not buying aircraft and power companies are not buying turbines. (more)
Gold
New York: Spot gold is down 70 cents at $US 316.90.
ASX Australia
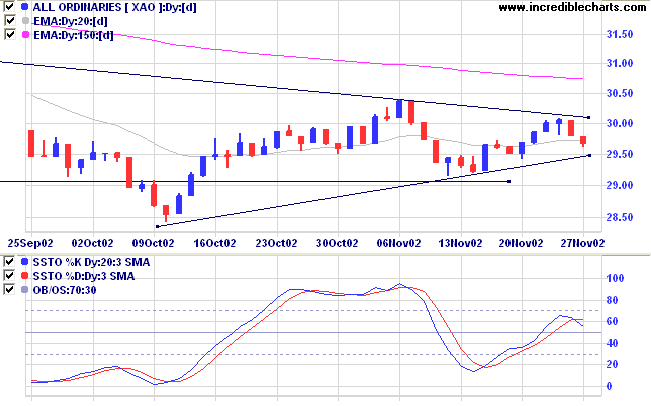
The All Ordinaries closed down 11 points at 2968 on lower
volume. The next day or two will tell if the index breaks down
from the symmetrical triangle.
The primary trend will reverse if the index rises above 3150.
The Slow Stochastic (20,3,3) has crossed below its signal line; MACD (26,12,9) is above; Twiggs money flow is falling.
The primary trend will reverse if the index rises above 3150.
The Slow Stochastic (20,3,3) has crossed below its signal line; MACD (26,12,9) is above; Twiggs money flow is falling.
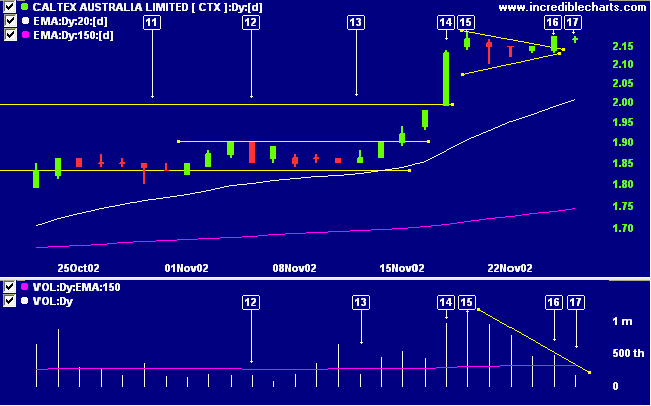
Caltex Australia [CTX]
Last covered on November 25.
CTX broke up from a bullish pennant pattern at [16] but with no sharp increase in volume as expected. The next day formed a doji with even lower volume [17]. The last two days combine to make a doji star pattern. A doji star reversal is completed by the following bar closing more than half way down the body of the first bar [16].
Back Issues
Last covered on November 25.
CTX broke up from a bullish pennant pattern at [16] but with no sharp increase in volume as expected. The next day formed a doji with even lower volume [17]. The last two days combine to make a doji star pattern. A doji star reversal is completed by the following bar closing more than half way down the body of the first bar [16].
A close below 2.16 will be a bear signal, while a rise above
2.19 will be a strong bull signal, especially if accompanied
by a surge in volume.
Market strategy
For further guidance see Understanding the Trading Diary.
For further guidance see Understanding the Trading Diary.
Short-term: Avoid new entries. The Slow Stochastic and MACD
are on opposite sides of their respective signal lines.
Medium-term: Avoid new entries. Use stop losses to protect
yourself against a sudden reversal.
Long-term: Wait for confirmation of the
bottom reversal signal.
Colin Twiggs
Long term survival depends much more on
personal discipline
than on market knowledge.
- Alan S Farley: The Master Swing Trader
than on market knowledge.
- Alan S Farley: The Master Swing Trader
Back Issues
Click here to access the
Trading Diary Archives.
Back Issues
Access the Trading Diary Archives.

Author: Colin Twiggs is a former investment banker with almost 40 years of experience in financial markets. He co-founded Incredible Charts and writes the popular Trading Diary and Patient Investor newsletters.
Using a top-down approach, Colin identifies key macro trends in the global economy before evaluating selected opportunities using a combination of fundamental and technical analysis.
Focusing on interest rates and financial market liquidity as primary drivers of the economic cycle, he warned of the 2008/2009 and 2020 bear markets well ahead of actual events.
He founded PVT Capital (AFSL No. 546090) in May 2023, which offers investment strategy and advice to wholesale clients.