Chart Forum: Email
To contact another member, click on their link in the left margin. In the Profile page you will find:
Trading Diary
November 22, 2002
These extracts from my daily trading diary are intended to
illustrate the techniques used in short-term trading and should
not be interpreted as investment advice. Full terms and
conditions can be found at Terms
of Use .
Understanding the Trading Diary provides further guidance.
USA
The Dow took a breather, forming an inside day
and closing down 0.5% at 8804 on lower volume.
The primary trend will reverse (up) if the index rises above 9130.
On the 21st the Nasdaq Composite Index completed a primary trend reversal on strong volume. The index closed almost unchanged today at 1468.
The S&P 500 closed 3 points down at 930.
The primary trend will complete a double bottom reversal if it rises above 965.
The Chartcraft NYSE Bullish % Indicator signals a bull alert at 44% (November 21).
PC outlook
PC makers face a bleak Christmas. (more)
Gold
New York: Spot gold is up 340 cents at $US 320.60.
PC makers face a bleak Christmas. (more)
Gold
New York: Spot gold is up 340 cents at $US 320.60.
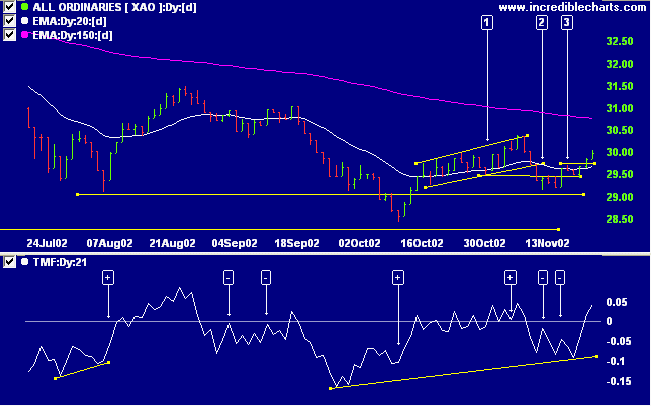
ASX Australia
The All Ordinaries closed up 14 points at 2999 on strong
volume.
The primary trend will reverse if the index rises above 3150.
The MACD (26,12,9) and Slow Stochastic (20,3,3) are above their signal lines; Twiggs money flow signals accumulation.
The primary trend will reverse if the index rises above 3150.
The MACD (26,12,9) and Slow Stochastic (20,3,3) are above their signal lines; Twiggs money flow signals accumulation.
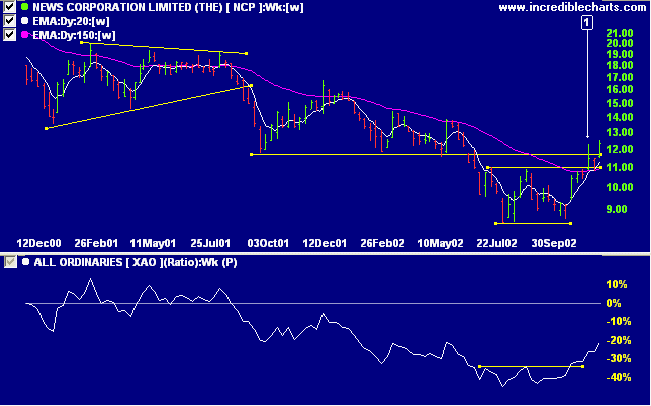
News Corporation [NCP]
Last covered on November 14, 2002.
NCP formed a double bottom reversal, completed at [1]. This was followed by a pull-back to test the new support level and then a second rally.
Back Issues
Last covered on November 14, 2002.
NCP formed a double bottom reversal, completed at [1]. This was followed by a pull-back to test the new support level and then a second rally.
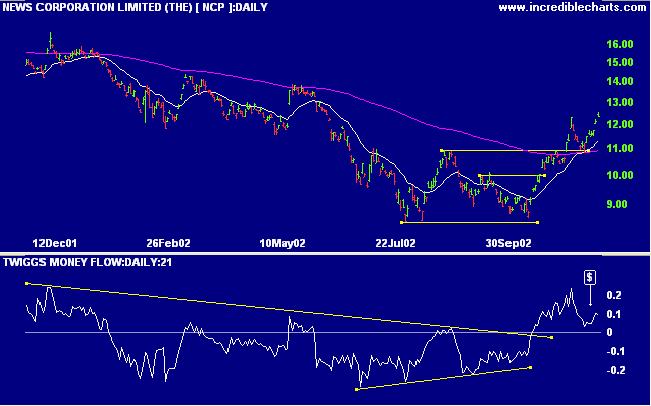
Twiggs money flow confirmed the double bottom with a bullish
divergence and has followed this up with a bullish trough [$]
above the zero line.
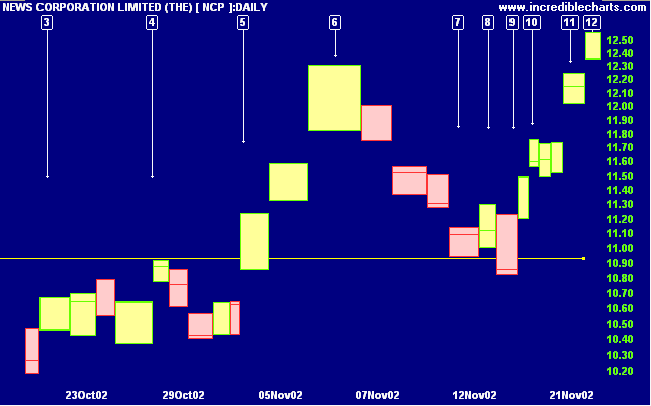
The pull-back to the support level briefly crossed below
10.92, emphasizing the importance of not placing stops right
at the support level. NCP exhibits a large number of gaps,
probably because of the overnight trading in NWS, its US
counter-part. The gaps are unlikely to be as important as in
other stocks and should only influence your decision-making
where they are accompanied by strong volume.
The bar at [12] displays a long shadow, signaling weakness, and the stock may well pull back to re-test the 10.92 support level.
The bar at [12] displays a long shadow, signaling weakness, and the stock may well pull back to re-test the 10.92 support level.
Sector Analysis
Changes are highlighted in bold.
Changes are highlighted in bold.
- Energy [XEJ] - stage 4 (RS is level)
- Materials [XMJ] - stage 2 (RS is rising)
- Industrials [XNJ] - stage 4 (RS is falling)
- Consumer Discretionary [XDJ] - stage 2 (RS is rising)
- Consumer Staples [XSJ] - stage 4 (RS is falling)
- Health Care [XHJ] - stage 1 (RS is level)
- Property Trusts [XPJ] - stage 3 (RS is rising)
- Financial excl. Property Trusts [XXJ] - stage 4 (RS is falling)
- Information Technology [XIJ] - stage 4 (RS is falling)
- Telecom Services [XTJ] - stage 4 (RS is falling)
- Utilities [XUJ] - stage 2 (RS is rising)
Sectors: Relative Strength
A stock screen of the ASX 200 using % Price Move (1 month: +5%) returned 30 stocks (compared to 99, August 23rd and 10 on October 4th). Notable sectors are:
A stock screen of the ASX 200 using % Price Move (1 month: +5%) returned 30 stocks (compared to 99, August 23rd and 10 on October 4th). Notable sectors are:
- Diversified Metals & Mining
- Construction Materials
- Casinos & Gaming
- Highways & Railtracks
- Gold
- REITs
Short-term: Long: The Slow Stochastic and MACD are above
their respective signal lines.
Medium-term: Long. Use stop losses to protect yourself
against a sudden reversal.
Long-term: Wait for confirmation of the
bottom reversal signal.
Colin Twiggs
I believe in the sun even when it is not
shining.
I believe in love even when I cannot feel it.
I believe in love even when I cannot feel it.
I believe in God even when he is
silent.
- written on a wall at Auschwitz concentration camp
- written on a wall at Auschwitz concentration camp
Back Issues
Click here to access the
Trading Diary Archives.
Back Issues
Access the Trading Diary Archives.

Author: Colin Twiggs is a former investment banker with almost 40 years of experience in financial markets. He co-founded Incredible Charts and writes the popular Trading Diary and Patient Investor newsletters.
Using a top-down approach, Colin identifies key macro trends in the global economy before evaluating selected opportunities using a combination of fundamental and technical analysis.
Focusing on interest rates and financial market liquidity as primary drivers of the economic cycle, he warned of the 2008/2009 and 2020 bear markets well ahead of actual events.
He founded PVT Capital (AFSL No. 546090) in May 2023, which offers investment strategy and advice to wholesale clients.