Chart Forum: Market Professionals
We request that individuals employed in the broking, financial planning, investment management or share trading (including software and training) industry, disclose their interest when posting to the Chart Forum. Failure to disclose will be viewed as a deliberate attempt to mislead members and will incur an advertising charge at penalty rates.
Our aim is to protect members from market professionals who recommend products or services, or talk up stocks, without disclosing their interest.
Trading Diary
November 18, 2002
These extracts from my daily trading diary are
intended to illustrate the techniques used in short-term trading
and should not be interpreted as investment advice. Full terms
and conditions can be found at Terms
of Use .
Understanding the Trading Diary provides further guidance.
USA
The Dow retreated 1% on low volume. A break
below 8200 will signal a secondary cycle down-trend.
The primary trend will reverse (up) if the index rises above 9130.
The Nasdaq Composite Index again tested resistance at 1426 before closing 1.2% down at 1393.
The primary trend will reverse (up) if the index breaks above 1426.
The S&P 500 imitated the Dow, closing 9 points down at 900.
The primary trend will complete a double bottom reversal if it rises above 965.
The Chartcraft NYSE Bullish % Indicator signals a bull alert at 40% (November 15).
Iraq
Weapons inspectors arrive in Baghdad. The crunch comes on December 8, when Iraq has to hand over a declaration of its weapons program. (more)
Gold
New York: Spot gold is down 110 cents at $US 319.20.
Weapons inspectors arrive in Baghdad. The crunch comes on December 8, when Iraq has to hand over a declaration of its weapons program. (more)
Gold
New York: Spot gold is down 110 cents at $US 319.20.
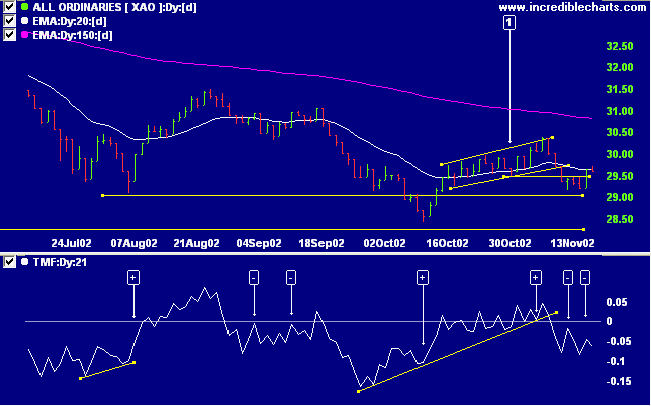
ASX Australia
The All Ordinaries took a breather, closing down 4 points at
2961 on lower volume.
The primary trend will reverse if the index rises above 3150.
The Slow Stochastic (20,3,3) is above its signal line, MACD (26,12,9) is below, while Twiggs money flow signals distribution.
The primary trend will reverse if the index rises above 3150.
The Slow Stochastic (20,3,3) is above its signal line, MACD (26,12,9) is below, while Twiggs money flow signals distribution.
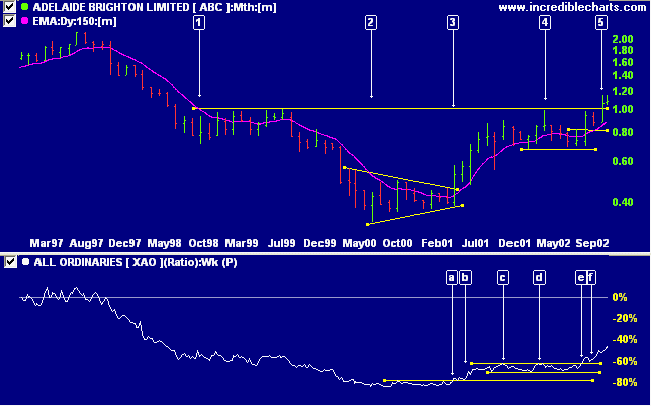
Adelaide Brighton Cement [ABC]
Last covered on October 17.
ABC has completed an inverted head and shoulders on the monthly chart: the left shoulder at [1], the head in the form of a triangle at [2] to [3], the right shoulder at [4], and the break through the neckline at [5]. The target for the pattern is 1.67 ( 1.00 + 1.00 - 0.33). Relative strength (price ratio: xao) started to rise [a] at the breakout from the bottom triangle at [3] and was confirmed when the next trough [b] respected support. The indicator then moved sideways for an extended period, forming equal highs at [c] and [d], before again breaking out at [e] with confirmation at [f].
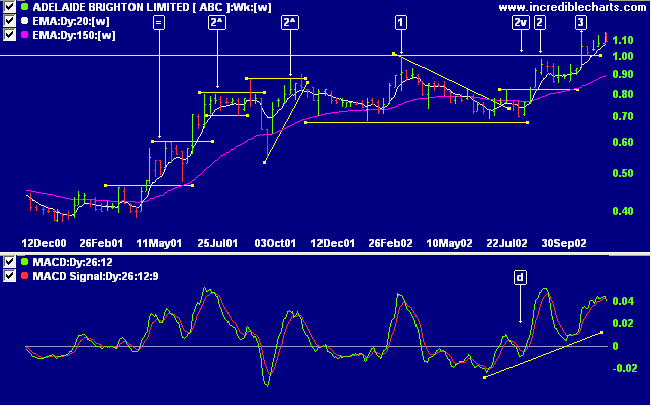
The weekly chart displays a
cup and handle pattern, with the cup from [1] to [2] and
the handle from [2] to [3]. MACD displays a bullish
divergence at [d], followed by an equal high at [2] before
the breakout at [3].
Twiggs money flow shows strong accumulation
since July, barely crossing below zero [+].
Back Issues
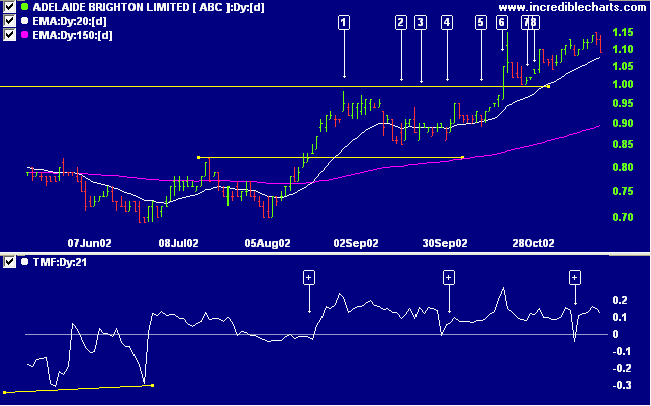
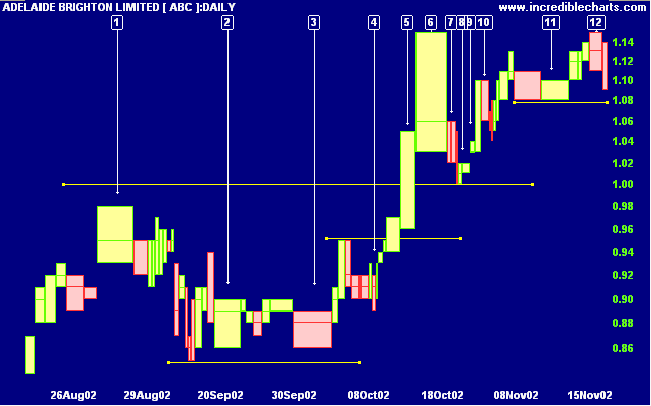
The equivolume chart reflects the
handle from the
cup and handle pattern. At [1] higher prices were
rejected with the broad bar showing increased volume and
the long upper shadow signaling that sellers had wrested
control away from buyers. [2] and [3] reflect strong buying
support at 0.86. The breakout from [4] is confirmed by
strong volume. The entry point was at 0.99 on completion of
the handle (avoid round numbers) with a stop-loss at 0.88,
below the recent low.
The long shadow at [6] warned of the
pull-back at [7] to [8]. A conservative entry point could
have been made on day [9] when price gapped above the high
of [8], respecting the 1.00 support level. The
counter-trend at [10] was short and on light volume.
Accumulation is signaled at [11] with over-square bars. The
latest correction at [12] is on higher volume.
A rise above 1.15 will be bullish, while a pull-back which respects the 1.15 support level will be a strong bull signal. A break below 1.08 will be bearish and may signal a re-test of support at 1.00.
A rise above 1.15 will be bullish, while a pull-back which respects the 1.15 support level will be a strong bull signal. A break below 1.08 will be bearish and may signal a re-test of support at 1.00.
Short-term: Avoid new entries: The Slow
Stochastic and MACD are on opposite sides of their
respective signal lines.
Medium-term: Avoid new entries. Use stop
losses to protect yourself against a sudden
reversal.
Long-term: Wait for confirmation of the
bottom reversal signal.
Colin Twiggs
I know of no more encouraging fact
than the unquestionable ability of man
to elevate his life by conscious endeavor.
- Henry David Thoreau
than the unquestionable ability of man
to elevate his life by conscious endeavor.
- Henry David Thoreau
Back Issues
Click here to access the
Trading Diary Archives.
Back Issues
Access the Trading Diary Archives.

Author: Colin Twiggs is a former investment banker with almost 40 years of experience in financial markets. He co-founded Incredible Charts and writes the popular Trading Diary and Patient Investor newsletters.
Using a top-down approach, Colin identifies key macro trends in the global economy before evaluating selected opportunities using a combination of fundamental and technical analysis.
Focusing on interest rates and financial market liquidity as primary drivers of the economic cycle, he warned of the 2008/2009 and 2020 bear markets well ahead of actual events.
He founded PVT Capital (AFSL No. 546090) in May 2023, which offers investment strategy and advice to wholesale clients.