Chart Forum
We have activated a Spell Checker to assist members with their postings.
Please inform us if there are any obvious words (like "MACD") that we have failed to add to the dictionary.
Trading Diary
November 07, 2002
These extracts from my daily trading diary are
intended to illustrate the techniques used in short-term trading
and should not be interpreted as investment advice. Full terms
and conditions can be found at Terms
of Use .
USA
The Dow fell 2.1% to 8586 on lower volume, above recent support.
The primary trend will reverse if the index rises above
9130.
The Nasdaq Composite Index fell almost 3% to 1377. The primary trend will reverse to up if the index breaks above 1426.
The S&P 500 lost 21 points to close at 902. The primary trend will complete a double bottom reversal if it rises above 965.
The Chartcraft NYSE Bullish % Indicator signals a bull alert at 40% (November 06).
Back Issues
The Nasdaq Composite Index fell almost 3% to 1377. The primary trend will reverse to up if the index breaks above 1426.
The S&P 500 lost 21 points to close at 902. The primary trend will complete a double bottom reversal if it rises above 965.
The Chartcraft NYSE Bullish % Indicator signals a bull alert at 40% (November 06).
Cisco spooks the market
The Internet equipment maker reported higher sales and earnings but warned of a worsening outlook for the next quarter. (more)
Gold
New York: Spot gold jumped 300 cents to $US 320.80.
The Internet equipment maker reported higher sales and earnings but warned of a worsening outlook for the next quarter. (more)
Gold
New York: Spot gold jumped 300 cents to $US 320.80.
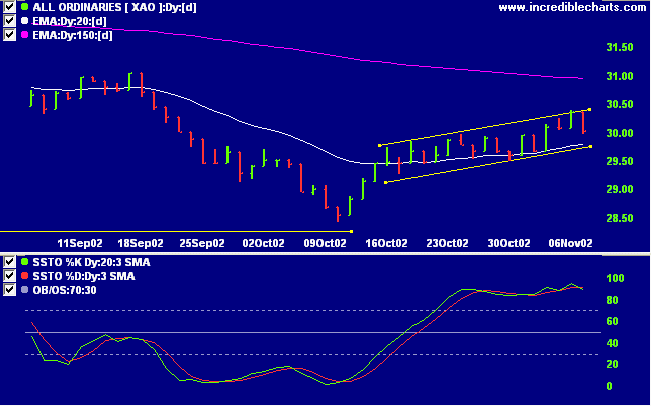
ASX Australia
Due to technical difficulties the ASX did not open for trading
until 1.35 p.m. This obviously disrupted normal trading
patterns and the All Ordinaries index fell more than 1% to
close at 3002 on low volume; remaining within the bullish flag
pattern. The primary trend will reverse if the index rises
above 3150.
The Slow Stochastic (20,3,3) closed below its signal line, MACD (26,12,9) is above, while Twiggs money flow continues to signal accumulation.
The Slow Stochastic (20,3,3) closed below its signal line, MACD (26,12,9) is above, while Twiggs money flow continues to signal accumulation.
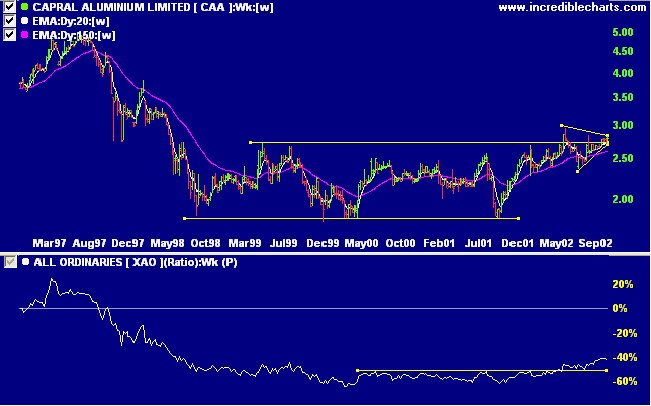
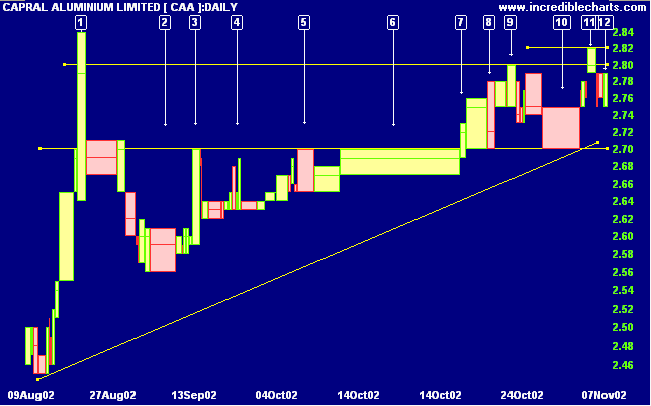
Capral Aluminium [CAA]
After reaching 5.00 in 1997 CAA entered a stage 4 down-trend followed by a broad stage 1 base. Price ranged between 1.80 and 2.70 for more than 4 years before failed breakouts in June and August 2002. The stock has now formed a bullish triangle pattern astride the upper boundary of the previous trading range: price is consolidating at this level rather than retreating back to support at 1.80. Relative strength (price ratio: xao) is rising.
After reaching 5.00 in 1997 CAA entered a stage 4 down-trend followed by a broad stage 1 base. Price ranged between 1.80 and 2.70 for more than 4 years before failed breakouts in June and August 2002. The stock has now formed a bullish triangle pattern astride the upper boundary of the previous trading range: price is consolidating at this level rather than retreating back to support at 1.80. Relative strength (price ratio: xao) is rising.
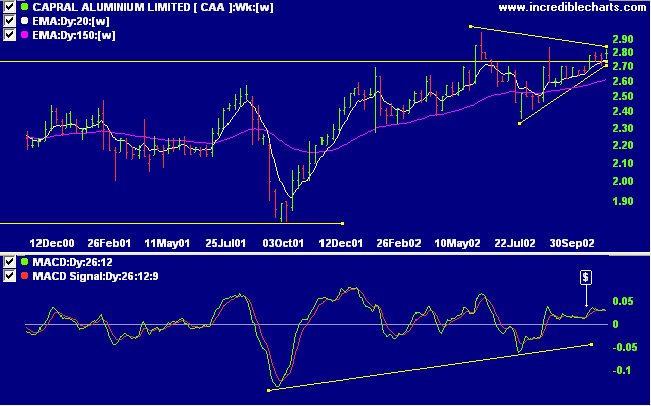
MACD has given a bullish confirmation at [$] after a strong
rise.
On closer analysis of the daily chart I would classify the
pattern as an ascending triangle, a bullish pattern in its own
right: the first high at [1] closed at 2.85 and was followed by
a spike reversal on the following day.
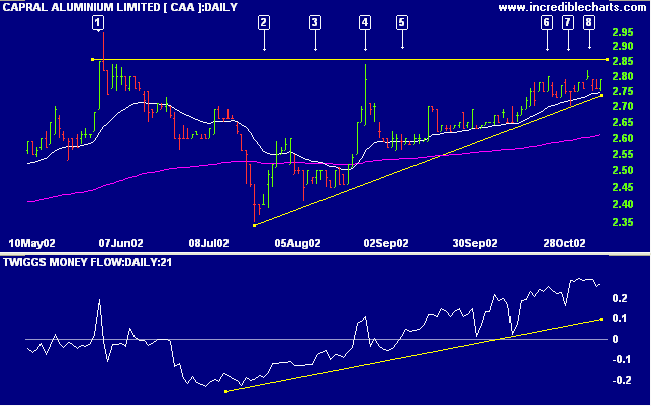
Twiggs money flow signals accumulation.
Twiggs money flow signals accumulation.
Day [1] on the equivolume chart equals day [4] on the daily
chart above.
The spike at [1] encountered resistance at 2.84 and retreated to [2]. Then several equal highs formed at [3], [4] and [5], as CAA encountered resistance at 2.70, before broad volume at [6] overcame selling pressure, producing a breakout on day [7]. Subsequent corrections at [8] and [10] have respected the new support level, with buying support signaled by the long shadow at [10].
The break above resistance at 2.80 failed to hold, but the ensuing 3 day counter-trend is on weak volume.
Short-term traders may be setting buy-stops above 2.80, to pick up the resumption of the up-trend, with their stop-loss one or two ticks below the low of [12]. Those who prefer to taker a longer view will wait for stronger signals.
A break above 2.85 will be a bullish signal, while a fall below 2.70 would be bearish.
Short-term: Avoid new trades: The Slow Stochastic and MACD are
on opposite sides of their respective signal lines, but the
Stochastic is in oversold territory.
Medium-term: Avoid new entries. Use stop losses to protect
yourself against a sudden reversal.
Long-term: Wait for confirmation of the
bottom reversal signal.
Colin Twiggs
Good people are good because they come to
wisdom through failure.
- William Saroyan.
- William Saroyan.
Back Issues
Click here to access the
Trading Diary Archives.
Back Issues
Access the Trading Diary Archives.

Author: Colin Twiggs is a former investment banker with almost 40 years of experience in financial markets. He co-founded Incredible Charts and writes the popular Trading Diary and Patient Investor newsletters.
Using a top-down approach, Colin identifies key macro trends in the global economy before evaluating selected opportunities using a combination of fundamental and technical analysis.
Focusing on interest rates and financial market liquidity as primary drivers of the economic cycle, he warned of the 2008/2009 and 2020 bear markets well ahead of actual events.
He founded PVT Capital (AFSL No. 546090) in May 2023, which offers investment strategy and advice to wholesale clients.