Crosshairs
To use crosshairs on the charts, select View >> Crosshair Cursor.
Click and drag to move the crosshairs across the chart.
If you have the Zoom function engaged, depress the Alt key before clicking and dragging.
Trading Diary
October 29, 2002
These extracts from my daily trading diary are
intended to illustrate the techniques used in short-term trading
and should not be interpreted as investment advice. Full terms
and conditions can be found at Terms
of Use .
USA
The Dow dropped sharply in early trading but
later rallied to close unchanged at 8368 on average volume. The
market is moving sideways, signaling uncertainty. A primary trend
reversal will be signaled if the index rises above 9130.
The Nasdaq Composite Index lost 1.2% to close at 1300. The primary trend will reverse if the index breaks above 1426.
The S&P 500 lost 8 points to close at 882. The primary trend is down. The index will complete a double bottom reversal if it rises above 965.
The Chartcraft NYSE Bullish % Indicator has swung to a bull alert signal at 36% (October 28).
Consumer confidence dives
The Conference Board consumer confidence index fell to 79.4 in October from 93.7 in September, much worse than the expected 4-point drop. (more)
Back Issues
The Conference Board consumer confidence index fell to 79.4 in October from 93.7 in September, much worse than the expected 4-point drop. (more)
Rate cuts expected
The plunging consumer confidence figures may force the Fed to further cut rates at its November 6 meeting. (more)
Gold
New York: Spot gold rallied a further 140 cents at $US 316.70. The gold chart has been forming a bullish ascending triangle over the last 6 months.
The plunging consumer confidence figures may force the Fed to further cut rates at its November 6 meeting. (more)
Gold
New York: Spot gold rallied a further 140 cents at $US 316.70. The gold chart has been forming a bullish ascending triangle over the last 6 months.
ASX Australia
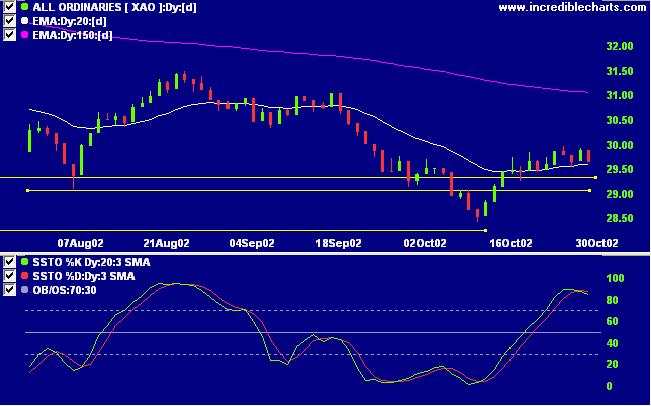
The All Ordinaries lost 23 points to close at 2967 on average
volume. The index is still moving sideways, signaling
uncertainty. A rise above 3150 will signal a primary trend
reversal.
The Slow Stochastic (20,3,3) has crossed to below its signal line, MACD is above, while Twiggs money whipsaws around the zero line.
The Slow Stochastic (20,3,3) has crossed to below its signal line, MACD is above, while Twiggs money whipsaws around the zero line.
Orica [ORI]
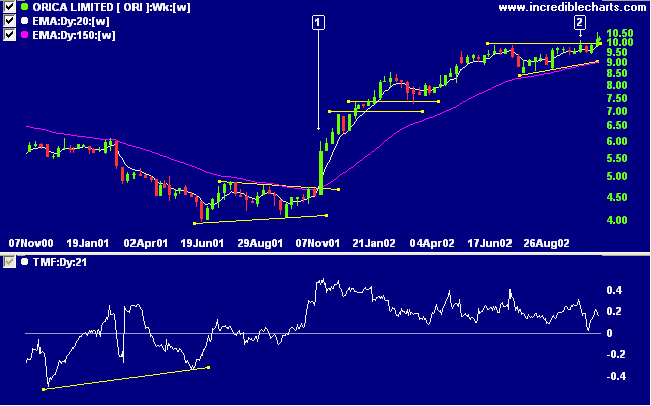
After reversing from a triangle pattern in 2001, ORI entered a stage 2 up-trend before leveling off in the last 6 months. The stock recently completed an ascending triangle at [2]. Relative strength (price ratio: xao) continues to rise while Twiggs money flow signals sustained accumulation over the last year.
After reversing from a triangle pattern in 2001, ORI entered a stage 2 up-trend before leveling off in the last 6 months. The stock recently completed an ascending triangle at [2]. Relative strength (price ratio: xao) continues to rise while Twiggs money flow signals sustained accumulation over the last year.
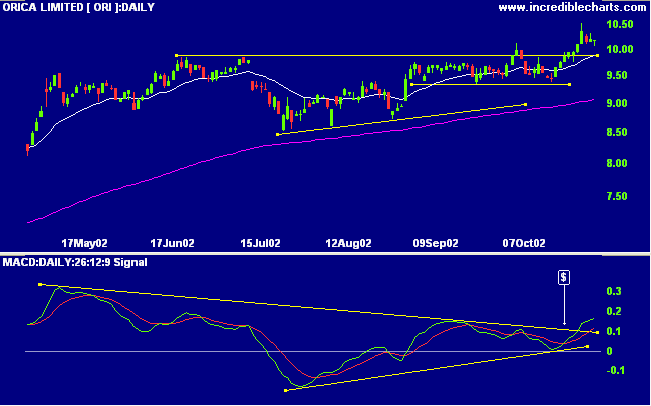
MACD has also formed a triangle over the last 6 months with an
upward breakout last week, after respecting the zero line at
[$], a bullish signal.
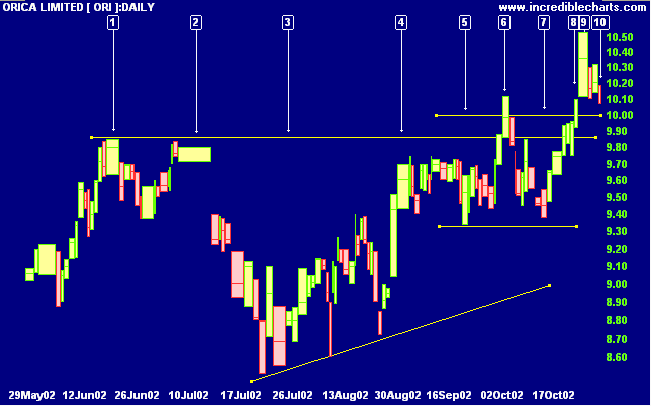
The equivolume chart shows strong distribution
at [1] and [2], most likely profit-taking by professional
traders ahead of resistance at 10.00. ORI then started to form
a series of higher lows at [3] followed by a test of resistance
at [4], the longish shadow signaling a fair number of sellers
entering the market. Price then formed a narrow congestion
pattern below the resistance level, with a failed breakout at
[6]. Congestion just below a resistance level is a strong
bullish signal, with the stock moving sideways rather
than correcting. The second breakout at [8] shows more promise:
the longer shadow at [9] shows selling pressure but volume has
since dried up. A rally in the next few days, without ORI
crossing below support at 10.00, will be a strong bull signal.
A rally above support at 9.85 would be a weaker bull signal.
The targeted move for a breakout is 11.40 (9.85 + 9.85 - 8.30).
Short-term: Avoid new entries. The Slow Stochastic and MACD are
on opposite sides of their respective signal lines.
Medium-term: Avoid new entries. Use stop losses to protect
yourself against a sudden reversal.
Long-term: Wait for confirmation of the
bottom reversal signal.
Colin Twiggs
Thought for the Day:
There is no such thing as failure, only feedback.
There is no such thing as failure, only feedback.
Back Issues
Click here to access the
Trading Diary Archives.
Back Issues
Access the Trading Diary Archives.

Author: Colin Twiggs is a former investment banker with almost 40 years of experience in financial markets. He co-founded Incredible Charts and writes the popular Trading Diary and Patient Investor newsletters.
Using a top-down approach, Colin identifies key macro trends in the global economy before evaluating selected opportunities using a combination of fundamental and technical analysis.
Focusing on interest rates and financial market liquidity as primary drivers of the economic cycle, he warned of the 2008/2009 and 2020 bear markets well ahead of actual events.
He founded PVT Capital (AFSL No. 546090) in May 2023, which offers investment strategy and advice to wholesale clients.