Incredible Charts 4.0.0.7
All chart legends can now be abbreviated.
Select Abbreviate Legend on the Format Charts menu.
This feature is especially useful when printing or emailing charts.
Trading Diary
October 24, 2002
These extracts from my daily trading diary are
intended to illustrate the techniques used in short-term trading
and should not be interpreted as investment advice. Full terms
and conditions can be found at Terms
of Use .
USA
The Dow lost more than 2% to close at 8317 on
lower volume. A primary trend reversal will be signaled if the
index rises above 9130.
The Nasdaq Composite Index lost 1.6% to close at 1298. The primary trend will reverse if there is a break above 1426.
The S&P 500 eased 14 points to close at 882. The primary trend is down. The index will complete a double bottom reversal if it rises above 965.
The Chartcraft NYSE Bullish % Indicator has swung to a bull alert signal at 34% (October 23).
Amazon.com
The online retailer reached operating break-even in the third-quarter on a 33% rise in revenues over a year earlier. (more)
Gold
New York: Spot gold is down 30 cents at $US 311.30.
The online retailer reached operating break-even in the third-quarter on a 33% rise in revenues over a year earlier. (more)
Gold
New York: Spot gold is down 30 cents at $US 311.30.
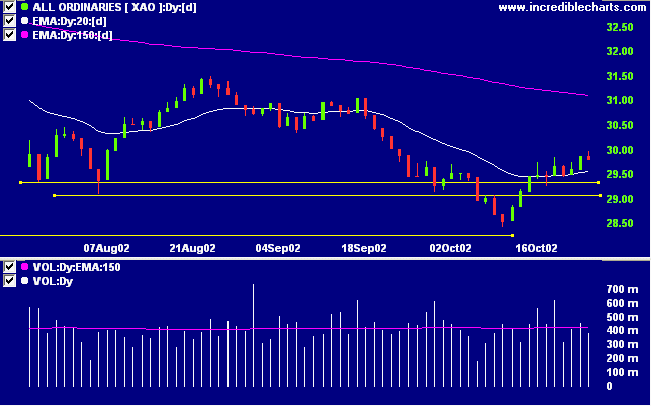
ASX Australia
The All Ordinaries closed 8 points down at 2979 on reassuringly
lower volume. A break above 3150 will signal a primary trend
reversal.
MACD (26,12,9) and Slow Stochastic (20,3,3) are above their signal lines. MACD shows a bullish divergence while Twiggs money continues to whipsaw around the zero line.
MACD (26,12,9) and Slow Stochastic (20,3,3) are above their signal lines. MACD shows a bullish divergence while Twiggs money continues to whipsaw around the zero line.
Caltex Australia [CTX]
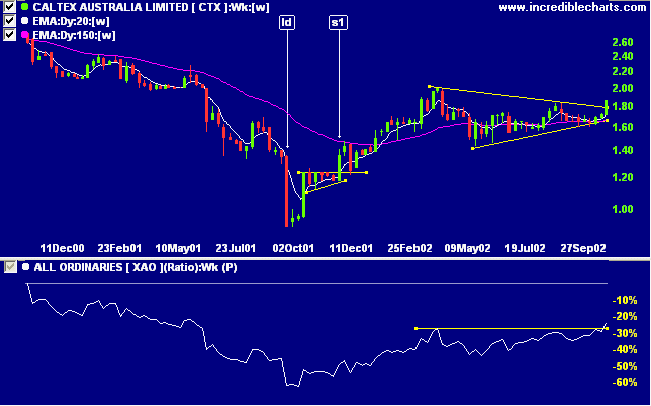
After a lengthy stage 4 down-trend CTX appears to have
experienced a final capitulation of sellers [ld] before reversing
into an up-trend. The up-trend encountered resistance at 2.00,
forming a symmetrical triangle below this level. The triangle has
now given a continuation signal in the last few days with an
upward breakout. Relative strength (price ratio: xao) has started
to trend upwards, signaled by the higher trough and a break above
the previous peak.
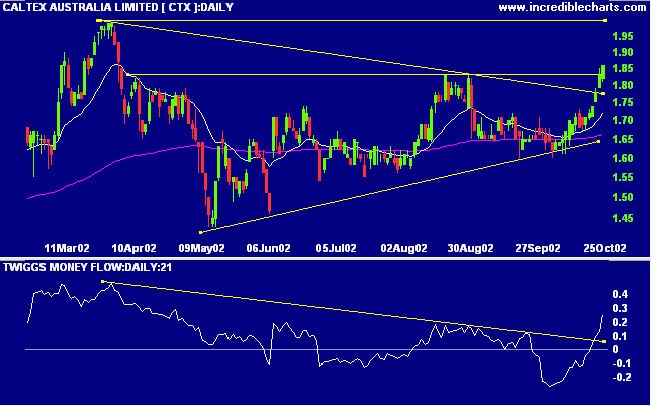
There are 2 horizontal lines drawn on the daily chart: the break
above resistance at 1.83 confirms the triangle breakout, while
2.00 represents the next major resistance level last tested in
March. Twiggs money flow signals accumulation and MACD is
bullish.
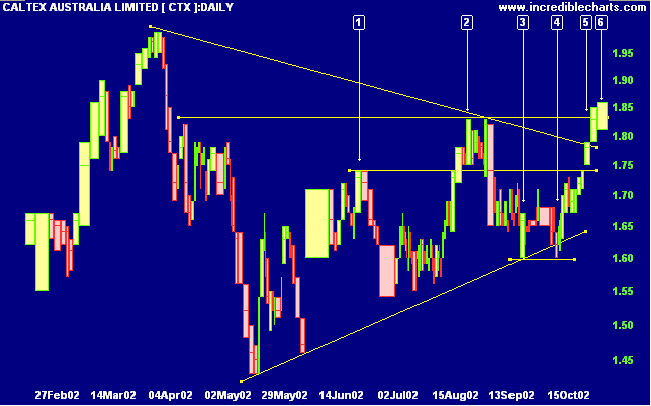
Triangle patterns are prone to false breakouts as can be seen at
[4] on the equivolume chart. I find that a break below the
immediate support level, in this case below [3], is useful as
confirmation. The breakout from the triangle at [5] has been
confirmed by a break above resistance at 1.83. Observe how price
rose above 1.83 but closed back at the resistance level before
closing above on the following day [6].
The target objective for the triangle pattern is 2.39 (1.78 + 1.99 - 1.38), measured vertically from the base of the triangle to the highest peak and then projected up from the breakout point (1.78).
The target objective for the triangle pattern is 2.39 (1.78 + 1.99 - 1.38), measured vertically from the base of the triangle to the highest peak and then projected up from the breakout point (1.78).
Short-term: Long. The Slow Stochastic and MACD are above their
respective signal lines.
Medium-term: Long. Use stop losses to protect yourself against a
sudden reversal.
Long-term: Wait for confirmation of the
bottom reversal signal.
Colin Twiggs
Thought for the
Day:
Win or lose, everybody gets what they want out of the market.
Some people seem to like to lose, so they win by losing money.
- Ed Seykota, from Market Wizards by Jack Schwager.
Win or lose, everybody gets what they want out of the market.
Some people seem to like to lose, so they win by losing money.
- Ed Seykota, from Market Wizards by Jack Schwager.
Back Issues
Click here to access the
Trading Diary Archives.
Back Issues
Access the Trading Diary Archives.

Author: Colin Twiggs is a former investment banker with almost 40 years of experience in financial markets. He co-founded Incredible Charts and writes the popular Trading Diary and Patient Investor newsletters.
Using a top-down approach, Colin identifies key macro trends in the global economy before evaluating selected opportunities using a combination of fundamental and technical analysis.
Focusing on interest rates and financial market liquidity as primary drivers of the economic cycle, he warned of the 2008/2009 and 2020 bear markets well ahead of actual events.
He founded PVT Capital (AFSL No. 546090) in May 2023, which offers investment strategy and advice to wholesale clients.