Chart Forum Registration
Some readers have encountered difficulties registering for the new Chart Forum.
The emailed hyperlink is sometimes severed if it wraps over 2 lines.
HTML still has its idiosyncracies.......we are working on a solution.
Trading Diary
October 23, 2002
These extracts from my daily trading diary are
intended to illustrate the techniques used in short-term trading
and should not be interpreted as investment advice. Full terms
and conditions can be found at Terms
of Use .
USA
The Dow retreated in the morning but then
rallied in the afternoon to close up 0.5% at 8494 on higher
volume. A primary trend reversal will be signaled if the index
rises above 9130.
The Nasdaq Composite Index gained 2.2% to close at 1320. The primary trend will reverse if there is a break above 1426.
The S&P 500 edged up 6 points to close at 896. The primary trend is down. The index will complete a double bottom reversal if it rises above 965.
The Chartcraft NYSE Bullish % Indicator has swung to a bull alert signal at 34% (October 21).
AOL Time Warner
The media giant is forced to restate earnings by $US 97 million over 2 years, because of overstatement of advertising revenue in its AOL division. (more)
Gold
New York: Spot gold was down 80 cents at $US 311.60.
The media giant is forced to restate earnings by $US 97 million over 2 years, because of overstatement of advertising revenue in its AOL division. (more)
Gold
New York: Spot gold was down 80 cents at $US 311.60.
ASX Australia
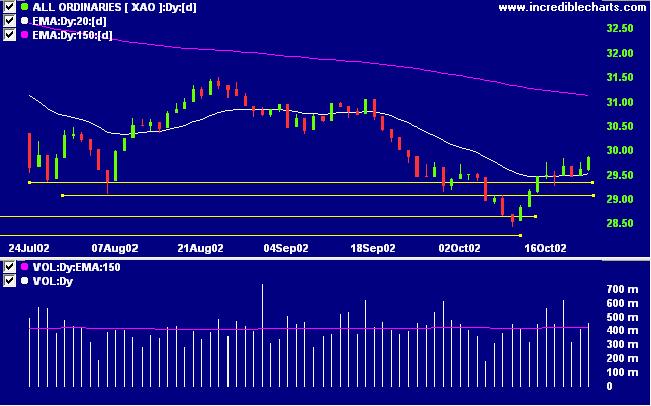
The All Ordinaries put in another strong day, closing up 26
points up at 2987 on higher volume. A break above 3150 will
signal a primary trend reversal.
MACD (26,12,9) and Slow Stochastic (20,3,3) are above their signal lines. MACD shows a bullish divergence while Twiggs money signals accumulation.
MACD (26,12,9) and Slow Stochastic (20,3,3) are above their signal lines. MACD shows a bullish divergence while Twiggs money signals accumulation.
Coates Hire [COA]
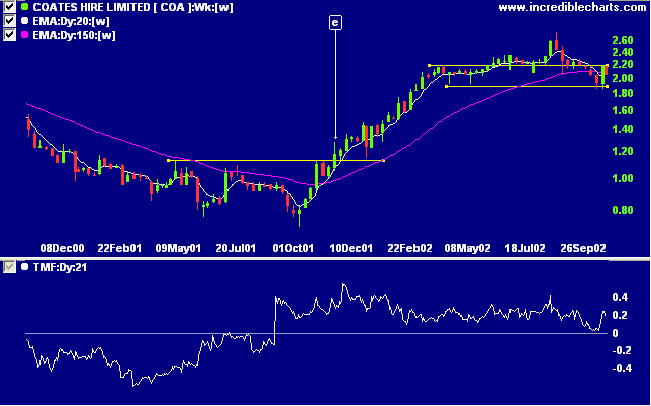
After presenting a favorable entry point at [e] COA rallied strongly before leveling off into a congestion pattern: either a top or a consolidation before a further rally. Twiggs money flow displays an impressive 12 months of accumulation, never once crossing below zero.
After presenting a favorable entry point at [e] COA rallied strongly before leveling off into a congestion pattern: either a top or a consolidation before a further rally. Twiggs money flow displays an impressive 12 months of accumulation, never once crossing below zero.
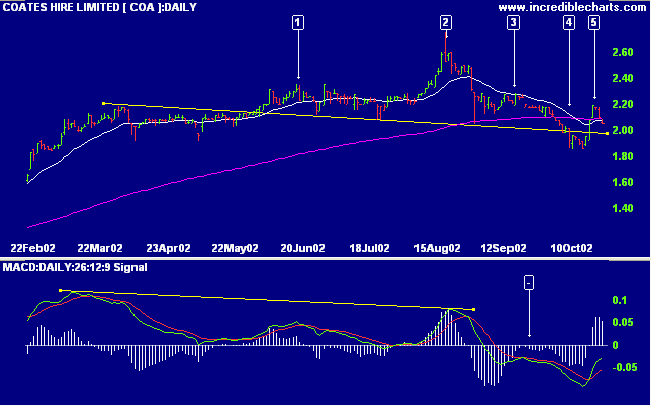
The daily chart shows a head and shoulders reversal pattern, with
the head at [2] and shoulders at [1] and [3]. MACD displays
weakness [-] after a bearish divergence. Price
broke below the neckline at [4] before rallying back above at
[5]. Is this a bear trap?
The equivolume chart shows healthy volume at the first shoulder
[1] as expected. Instead of declining, volume at [2] is stronger,
but followed by a closing price reversal at [3]. Price drops
sharply at [4], on comparatively thin volume, before a brief
rally at [5], again on stronger volume. Finally, volume at the
breakout [6] is weak, confirming that the pattern is not to be
trusted: In a healthy head and shoulders pattern, volume should
decline on each successive rally and increase on each successive
correction, ending with a sharp rise at the breakout.
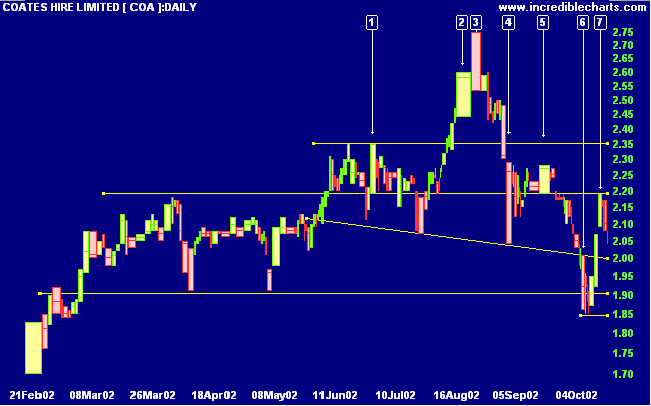
The rally back to [7] was unable to overcome resistance at 2.20
and we can expect the stock to range further before giving a
clear signal.
Short-term: Long. The Slow Stochastic and
MACD are above their respective signal lines.
Medium-term: Long. Use stop losses to
protect yourself against a sudden reversal.
Long-term: Wait for confirmation of the
bottom reversal signal.
Colin Twiggs
Thought for the
Day:
Stan's 9th Commandment:
Don't guess a bottom. What looks like a bargain can turn out to be a very expensive stage 4 disaster.
Instead, buy on breakouts above resistance.
- Stan Weinstein, Secrets for Profiting in Bull and Bear Markets.
Stan's 9th Commandment:
Don't guess a bottom. What looks like a bargain can turn out to be a very expensive stage 4 disaster.
Instead, buy on breakouts above resistance.
- Stan Weinstein, Secrets for Profiting in Bull and Bear Markets.
Back Issues
Click here to access the
Trading Diary Archives.
Back Issues
Access the Trading Diary Archives.

Author: Colin Twiggs is a former investment banker with almost 40 years of experience in financial markets. He co-founded Incredible Charts and writes the popular Trading Diary and Patient Investor newsletters.
Using a top-down approach, Colin identifies key macro trends in the global economy before evaluating selected opportunities using a combination of fundamental and technical analysis.
Focusing on interest rates and financial market liquidity as primary drivers of the economic cycle, he warned of the 2008/2009 and 2020 bear markets well ahead of actual events.
He founded PVT Capital (AFSL No. 546090) in May 2023, which offers investment strategy and advice to wholesale clients.