Some readers have encountered difficulties registering for the new Chart Forum.
The emailed hyperlink is sometimes severed if it wraps over 2 lines.
HTML still has its idiosyncracies.......we are working on a solution.
Trading Diary
October 22, 2002
The Nasdaq Composite Index retreated 1.3% to 1292, forming an inside day. The primary trend will reverse if there is a break above 1426.
The S&P 500 formed an inside day, losing 9 points to close at 890. The primary trend is down. The index will complete a double bottom reversal if it rises above 965.
The Chartcraft NYSE Bullish % Indicator has swung to a bull alert signal at 32% (October 21).
AT&T reports falling revenues in the third-quarter but manages earnings of 6 cents a share, compared to a loss of 69 cents a year earlier. (more)
Gold
New York: Spot gold was up 180 cents at $US 312.40.
MACD (26,12,9) and Slow Stochastic (20,3,3) are above their signal lines. MACD shows a bullish divergence while Twiggs money whipsaws around the zero line after a bullish divergence.

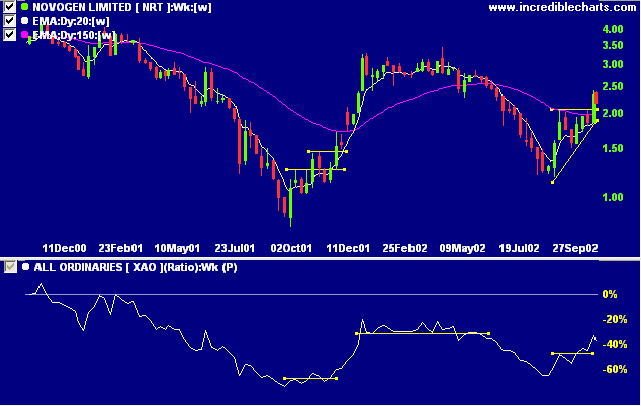
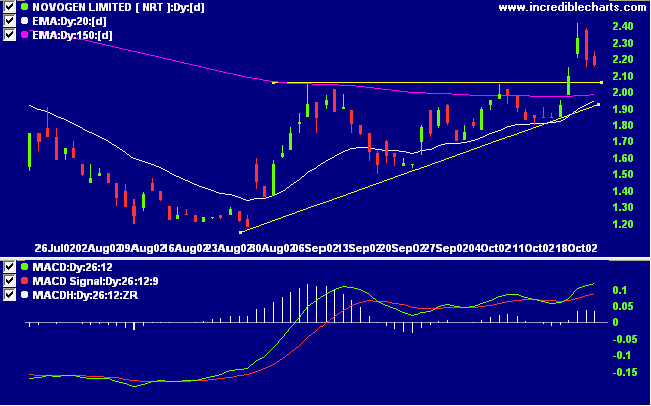
A loss-making biotech stock, NRT displays 2 troughs over the last year, the latest trough being visibly higher than the first. The stock has now completed an ascending triangle with relative strength (price ratio: xao) rising steeply.


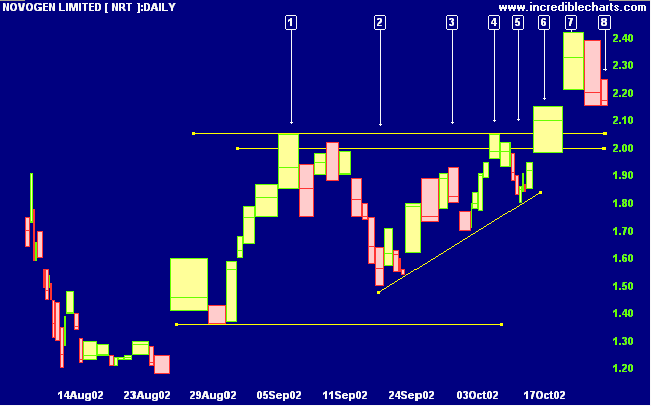
The stop-loss after the first entry should be positioned below the low at [5]. After day [7] consider adjusting the stop-loss up to just below 2.00. The reasons for this are twofold: (1) 2.00 is at the bottom of the 2.00 to 2.05 support band; and (2) 2.00 represents a 2/3 retracement of the last up-swing (from [5] to [7] ) - anything more than 2/3 retracement would signal weakness.

Recognizing when the market has hit a top or bottomed out is 50% of the whole complicated ball game.
It is also the key investing skill that all too many professional and amateur investors seem to lack.
- William J O'Neil, How to Make Money in Stocks.
Back Issues

Author: Colin Twiggs is a former investment banker with almost 40 years of experience in financial markets. He co-founded Incredible Charts and writes the popular Trading Diary and Patient Investor newsletters.
Using a top-down approach, Colin identifies key macro trends in the global economy before evaluating selected opportunities using a combination of fundamental and technical analysis.
Focusing on interest rates and financial market liquidity as primary drivers of the economic cycle, he warned of the 2008/2009 and 2020 bear markets well ahead of actual events.
He founded PVT Capital (AFSL No. 546090) in May 2023, which offers investment strategy and advice to wholesale clients.
