Incredible Charts 4.0.0.7
The new version provides an option to abbreviate the chart legend, on the Format Charts menu.
Incredible Charts should automatically update when you login.
Use Help >>About to check that you have the latest version.
Trading Diary
October 21, 2002
These extracts from my daily trading diary are intended to
illustrate the techniques used in short-term trading and should
not be interpreted as investment advice. Full terms and
conditions can be found at Terms
of Use .
USA
The Dow rose 2.6%, forming a continuation
flag, and closed at 8538 on average volume. A primary trend
reversal will be signaled if the index rises above 9130.
The Nasdaq Composite Index climbed 1.7% to close at 1309. The primary trend will reverse if there is a break above 1426.
The S&P 500 is also forming a continuation flag, closing up 1.7% at 899. The primary trend is down. The index will complete a double bottom reversal if it rises above 965.
The Chartcraft NYSE Bullish % Indicator reflects a bear confirmed signal at 26% (October 18).
Mixed results
Texas Instruments reported third-quarter earnings of 11 cents per share, compared to a loss of 3 cents a year ago, but warns that fourth-quarter sales and earnings will fall below estimates. (TI)
Dow component 3M Co. increased earnings by 38%, compared to the third quarter last year, and raised its guidance for the fourth quarter. (3M)
Back Issues
Texas Instruments reported third-quarter earnings of 11 cents per share, compared to a loss of 3 cents a year ago, but warns that fourth-quarter sales and earnings will fall below estimates. (TI)
Dow component 3M Co. increased earnings by 38%, compared to the third quarter last year, and raised its guidance for the fourth quarter. (3M)
Gold
New York: Spot gold was down 190 cents at $US 310.60.
New York: Spot gold was down 190 cents at $US 310.60.
ASX Australia
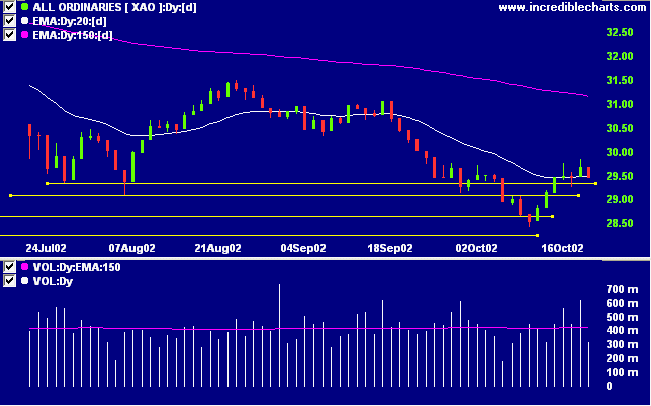
The All Ordinaries closed down 19 points at 2948 on
reassuringly low volume. A break above 3150 will signal a
primary trend reversal.
MACD (26,12,9) and Slow Stochastic (20,3,3) are above their signal lines. Twiggs money is whipsawing around the zero line after a bullish divergence.
MACD (26,12,9) and Slow Stochastic (20,3,3) are above their signal lines. Twiggs money is whipsawing around the zero line after a bullish divergence.
Chemeq [CMQ]
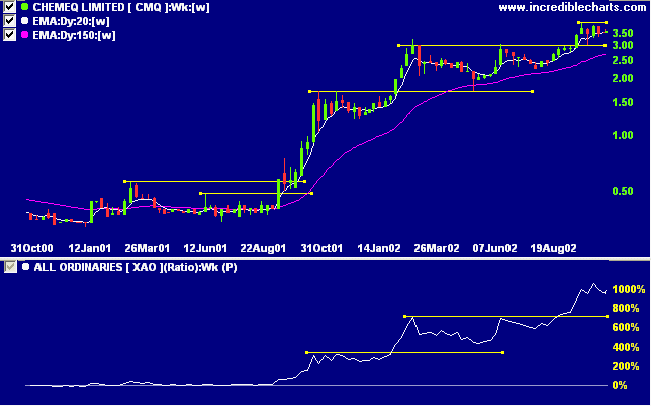
After a stage 2 up-trend CMQ broke through resistance at 3.00 and is now forming a pennant/symmetrical triangle between 3.00 and 4.00. Relative strength (price ratio: xao) continues to rise.
After a stage 2 up-trend CMQ broke through resistance at 3.00 and is now forming a pennant/symmetrical triangle between 3.00 and 4.00. Relative strength (price ratio: xao) continues to rise.
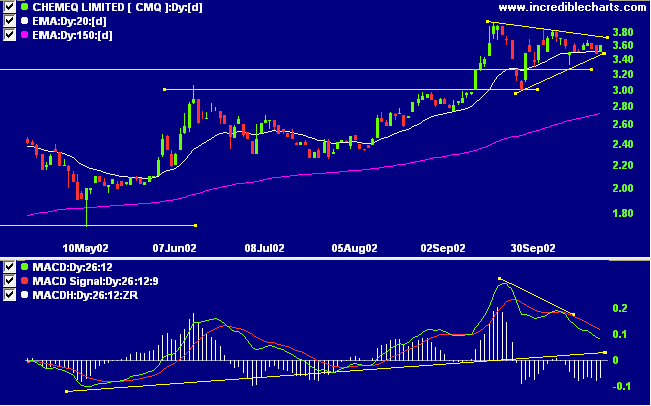
Congestion just below or above a resistance
level is normally a bullish sign. But, after being bullish for
some time, MACD and Twiggs money flow show bearish declines in
the last month.
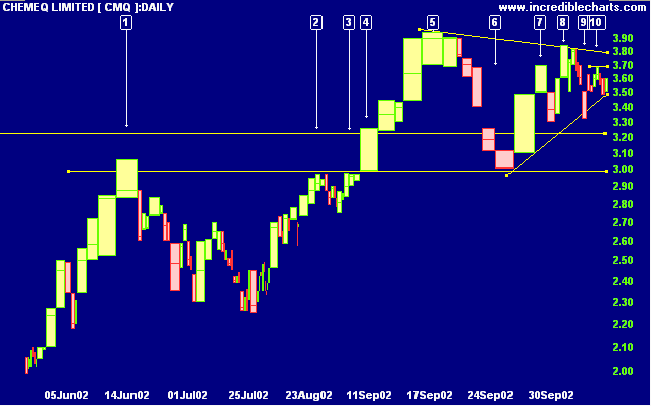
The equivolume chart shows strong support at
3.00. Notice how support formed at the round number and not at
the high of day [1]. The small correction between [2] and [3],
on light volume, was a good time to increase ones position.
Alternatively, accumulate on day [4] at the breakout. Rallies
to [5] and [7] were on strong volume but this has faded on the
next two rallies at [8] and [10]. I will only increase the
position if MACD and TMF hold above zero and price breaks above
3.80 on strong volume.
A break below 3.30 would be bearish.
Short-term: Long. The
Slow Stochastic and MACD are above their respective signal
lines.
Medium-term: Long.
Use stop losses to protect yourself against a sudden
reversal.
Long-term: Wait for confirmation of the
bottom reversal signal.
Colin Twiggs
Thought for
the Day:
Many people watch, but few see.
- Monty Roberts, Horse Sense for People.
Many people watch, but few see.
- Monty Roberts, Horse Sense for People.
Back Issues
Click here to access the
Trading Diary Archives.
Back Issues
Access the Trading Diary Archives.

Author: Colin Twiggs is a former investment banker with almost 40 years of experience in financial markets. He co-founded Incredible Charts and writes the popular Trading Diary and Patient Investor newsletters.
Using a top-down approach, Colin identifies key macro trends in the global economy before evaluating selected opportunities using a combination of fundamental and technical analysis.
Focusing on interest rates and financial market liquidity as primary drivers of the economic cycle, he warned of the 2008/2009 and 2020 bear markets well ahead of actual events.
He founded PVT Capital (AFSL No. 546090) in May 2023, which offers investment strategy and advice to wholesale clients.