Incredible Charts 4.0.0.7
A new update will be released this weekend.
Use Help >>About to check that you have the latest version.
October 18, 2002
These extracts from my daily trading diary are intended to
illustrate the techniques used in short-term trading and should
not be interpreted as investment advice. Full terms and
conditions can be found at Terms
of Use .
USA
The Dow has formed a continuation
flag or
pennant, closing up 0.5% at 8322 on above-average volume. A
primary trend reversal will be signaled if the index rises above
9130.
The Nasdaq Composite Index gained more than 1% to close at 1287. The primary trend will reverse if there is a break above 1426.
The S&P 500 gained 5 points to close at 884, forming a continuation flag. The primary trend is down. The index will complete a double bottom reversal if it rises above 965.
The Chartcraft NYSE Bullish % Indicator reflects a bear confirmed signal at 26% (October 17).
Bonds down
Bond yields are rising sharply, with 10-year treasury notes up more than 0.5% from their 40-year low of 3.56% on October 9. (more)
Back Issues
Bond yields are rising sharply, with 10-year treasury notes up more than 0.5% from their 40-year low of 3.56% on October 9. (more)
Gold
New York: Spot gold was up slightly at $US 312.50.
New York: Spot gold was up slightly at $US 312.50.
ASX Australia
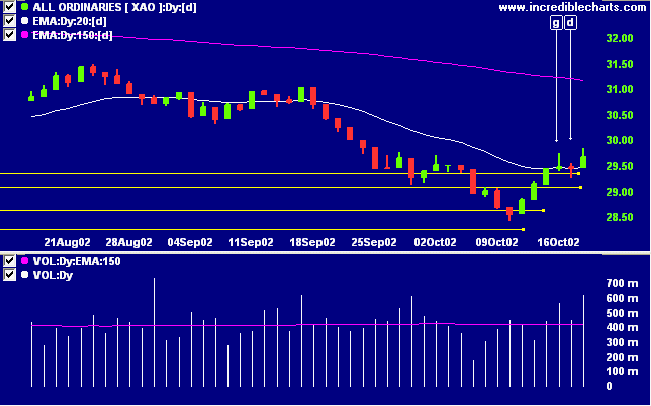
The All Ordinaries closed up 20 points at 2967 on strong
volume. A break above 3150 will signal a primary trend
reversal.
MACD (26,12,9) and Slow Stochastic (20,3,3) are above their signal lines. Twiggs money signals accumulation, after a bullish divergence.
MACD (26,12,9) and Slow Stochastic (20,3,3) are above their signal lines. Twiggs money signals accumulation, after a bullish divergence.
Coles Myer [CML]
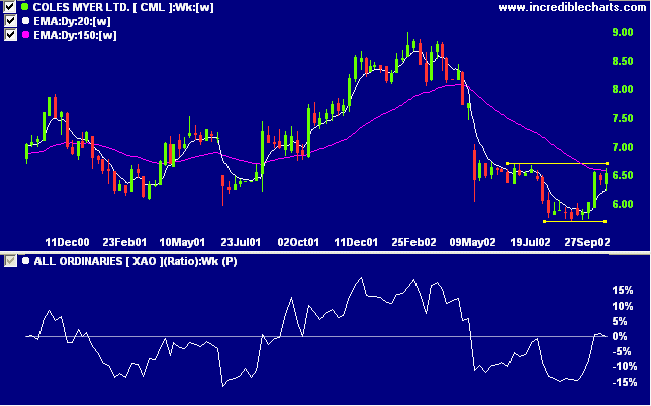
CML formed a U-shaped bottom, normally referred to as a rounded bottom or saucer pattern, after a stage 4 down-trend. One reader pointed out that the pattern resembles a cup and handle pattern - these tend to be unreliable if a stock is trending downwards. Relative strength (price ratio: xao) shows a slight improvement.
CML formed a U-shaped bottom, normally referred to as a rounded bottom or saucer pattern, after a stage 4 down-trend. One reader pointed out that the pattern resembles a cup and handle pattern - these tend to be unreliable if a stock is trending downwards. Relative strength (price ratio: xao) shows a slight improvement.
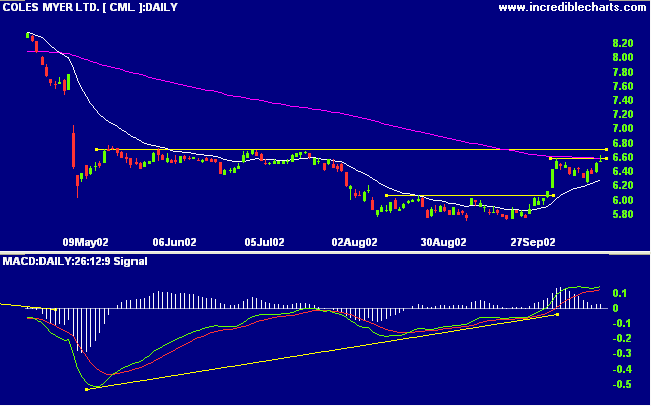
MACD displays a bullish divergence, while Twiggs money flow
signals accumulation.
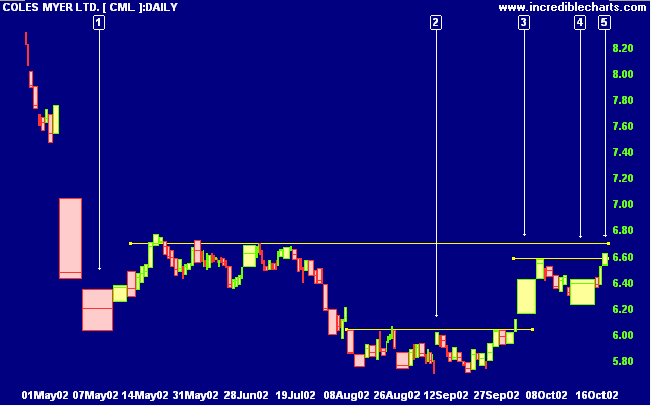
The equivolume chart shows strong support at 6.40 with
accumulation at [3] and [4]. The latest rally [5] lacks
conviction with low volume and a longer upper shadow signaling
rejection of higher prices.
The chart pattern can be treated as an inverted head and
shoulders, with the head at [2] and shoulders at [1] and [4].
The break above 6.55 penetrated the neckline at [5]. Strong
volume is required to confirm the breakout and a rise above
6.70 will give added confirmation.
Sector Analysis
Changes are highlighted in bold.
Changes are highlighted in bold.
- Energy [XEJ] - stage 4 (RS is rising)
- Materials [XMJ] - stage 4
- Industrials [XNJ] - stage 4 (RS is falling)
- Consumer Discretionary [XDJ] - stage 4
- Consumer Staples [XSJ] - stage 1 (RS is rising)
- Health Care [XHJ] - stage 4 (RS is falling)
- Property Trusts [XPJ] - stage 2 (RS is rising)
- Financial excl. Property Trusts [XXJ] - stage 4 (RS is falling)
- Information Technology [XIJ] - stage 4 (RS is falling)
- Telecom Services [XTJ] - stage 1 (RS is rising)
- Utilities [XUJ] - stage 2 (RS is rising)
Sectors: Relative Strength
A stock screen of the ASX 200 using % Price Move (1 month: +5%) returned 25 stocks (compared to 99, August 23rd and 10 on October 4th).
A stock screen of the ASX 200 using % Price Move (1 month: +5%) returned 25 stocks (compared to 99, August 23rd and 10 on October 4th).
Short-term: Long. The Slow Stochastic
and MACD are above their respective signal lines.
Medium-term: Long. Use stop losses to
protect yourself against a sudden reversal.
Long-term: Wait for confirmation of the
bottom reversal signal.
Colin Twiggs
Thought for the Day:
If a speculator is correct half the time he is hitting a good average. Even being right three or four times out of ten
should yield a person a fortune if he has the sense to cut his losses quickly on the ventures where he has been wrong.
- Bernard Baruch
If a speculator is correct half the time he is hitting a good average. Even being right three or four times out of ten
should yield a person a fortune if he has the sense to cut his losses quickly on the ventures where he has been wrong.
- Bernard Baruch
Back Issues
Click here to access the
Trading Diary Archives.
Back Issues
Access the Trading Diary Archives.

Author: Colin Twiggs is a former investment banker with almost 40 years of experience in financial markets. He co-founded Incredible Charts and writes the popular Trading Diary and Patient Investor newsletters.
Using a top-down approach, Colin identifies key macro trends in the global economy before evaluating selected opportunities using a combination of fundamental and technical analysis.
Focusing on interest rates and financial market liquidity as primary drivers of the economic cycle, he warned of the 2008/2009 and 2020 bear markets well ahead of actual events.
He founded PVT Capital (AFSL No. 546090) in May 2023, which offers investment strategy and advice to wholesale clients.