Thank you for the many useful suggestions. They help us to plan further development.
If you have suggestions as to how we can
improve the charts, website or newsletter,
please post them at the Chart
Forum: Suggestion Box.
Trading Diary
October 16, 2002
The Nasdaq Composite Index gapped down to close at 1232, a loss of almost 4%. The primary trend will reverse if there is a break above 1426.
The S&P 500 lost 21 points to close at 860, forming an inside day. The index will complete a double bottom if it rises above 965. The primary trend is down.
The Chartcraft NYSE Bullish % Indicator reflects a bear confirmed signal at 26% (October 15).
IBM reports third-quarter earnings of 99 cents per share, beating forecasts by 3 cents and up 2 cents on last year. (IBM)
Coke warns that full-year earnings may miss forecasts. (Coke)
New York: Spot gold last traded at $US 314.30, up 80 cents on yesterday.
A break above 3150 will signal a primary trend reversal.
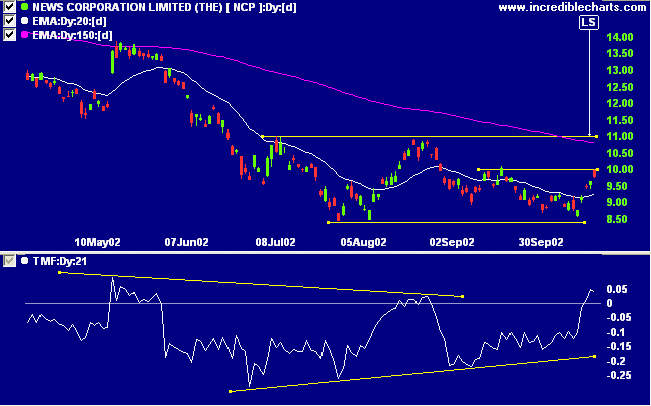
MACD (26,12,9) and Slow Stochastic (20,3,3) are above their signal lines. Twiggs money flow has dipped back below zero, after a bullish divergence.
Apologies for the gremlin in yesterday's diary: A break above 9.55 will be a bull signal.
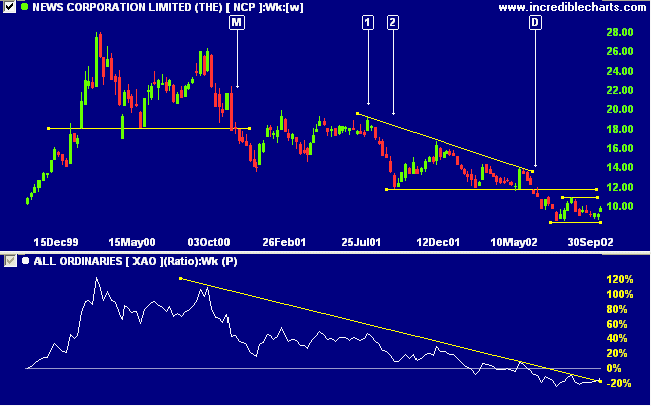
Last covered on September 13.
NCP has formed two fairly equal lows about 10 weeks apart, after a long stage 4 down-trend. Relative strength (price ratio: xao) has broken its downward trendline, warning of a possible reversal.
.....where Fortune is concerned: she shows her force where there is no organized strength to resist her;
and she directs her impact there where she knows that no dikes and embankments are constructed to hold her.
- Niccolo Machiavelli, The Prince (1532)
Back Issues

Author: Colin Twiggs is a former investment banker with almost 40 years of experience in financial markets. He co-founded Incredible Charts and writes the popular Trading Diary and Patient Investor newsletters.
Using a top-down approach, Colin identifies key macro trends in the global economy before evaluating selected opportunities using a combination of fundamental and technical analysis.
Focusing on interest rates and financial market liquidity as primary drivers of the economic cycle, he warned of the 2008/2009 and 2020 bear markets well ahead of actual events.
He founded PVT Capital (AFSL No. 546090) in May 2023, which offers investment strategy and advice to wholesale clients.