Suggestions
If you have any suggestions as to how we can improve the charts, website or newsletter,
please post them at the Chart Forum: Suggestion Box.
Trading Diary
October 10, 2002
These extracts from my daily trading diary are
intended to illustrate the techniques used in short-term trading
and should not be interpreted as investment advice. Full terms
and conditions can be found at Terms
of Use .
USA
The Dow formed a key
reversal, rallying 3.4% to 7533 on strong volume. There are 2
levels of resistance overhead at 7600 and 8000. The next major
support level is at 6936 from 1997.
The primary trend is down.
The Nasdaq Composite Index rallied strongly, gaining 4.4% to close at 1163. The next major support level is 1000, from 1996. The primary trend is down.
The S&P 500 also formed a key reversal, rising 3.5% to close at 803.
The primary trend is down.
The Chartcraft NYSE Bullish % Indicator reflects a bear confirmed signal at 26% (October 9).
The primary trend is down.
The Nasdaq Composite Index rallied strongly, gaining 4.4% to close at 1163. The next major support level is 1000, from 1996. The primary trend is down.
The S&P 500 also formed a key reversal, rising 3.5% to close at 803.
The primary trend is down.
The Chartcraft NYSE Bullish % Indicator reflects a bear confirmed signal at 26% (October 9).
Jobless claims fall
States received 384,000 applications for unemployment benefits last week, down 10% on the week before. (more)
States received 384,000 applications for unemployment benefits last week, down 10% on the week before. (more)
Iraq
The U.S. House of Representatives voted 296-133, giving President George W. Bush the power to go to war against Iraq. (more)
Back Issues
The U.S. House of Representatives voted 296-133, giving President George W. Bush the power to go to war against Iraq. (more)
Gold
New York: The spot gold price dropped sharply, down 330 cents at $US 316.40.
New York: The spot gold price dropped sharply, down 330 cents at $US 316.40.
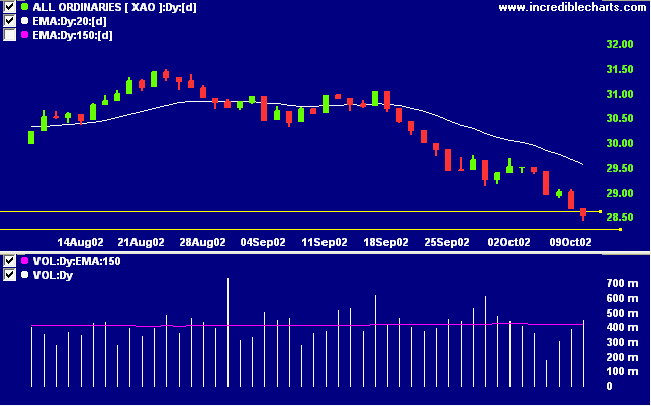
ASX Australia
The All Ordinaries broke support at 2867, closing down 15
points at 2855 on higher volume. The bottom of the support
band, from September 2001, is at 2828. The primary trend is
down.
Slow Stochastic (20,3,3) and MACD (26,12,9) are below their signal lines. Twiggs money flow signals distribution.
Slow Stochastic (20,3,3) and MACD (26,12,9) are below their signal lines. Twiggs money flow signals distribution.
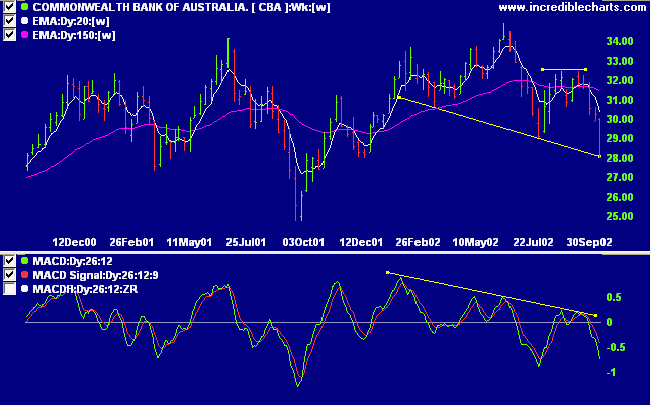
Commonwealth Bank [CBA]
Last covered on August 21, CBA has since formed a head and shoulders reversal pattern after a stage 2 up-trend.
Relative strength (price ratio: xao) has broken its upward trend and is falling. MACD shows a bearish divergence.
Last covered on August 21, CBA has since formed a head and shoulders reversal pattern after a stage 2 up-trend.
Relative strength (price ratio: xao) has broken its upward trend and is falling. MACD shows a bearish divergence.
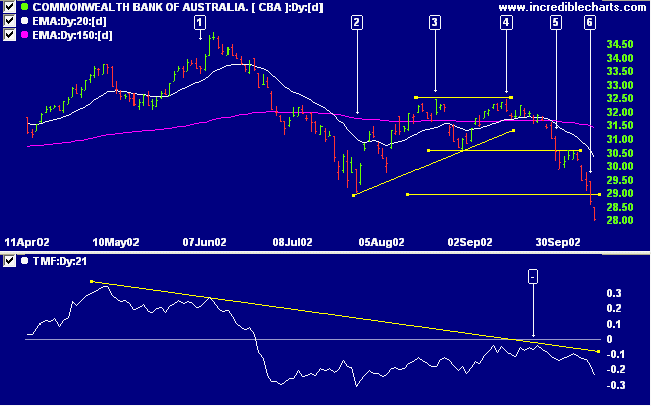
After equal tops at [3] and [4], CBA appeared to be forming
an
ascending triangle. But the pattern later developed into
a double
top with a break below the support level at [5]. Price
later broke through support at 29.00 and is testing support
at 28.00, to complete the head and shoulders pattern (on the
weekly chart above). Twiggs money flow signals strong
distribution with a further bear signal at [-], where a TMF
peak respects the zero line.
A break below 28.00 will be a strong bear signal. The
targeted move from the head and shoulders pattern is 5.36
(34.94 - 29.58) which gives an objective of 22.64 (28.00 -
5.36).
Short-term: Short. The Slow Stochastic and MACD are below
their respective signal lines.
Medium-term: Wait for the All Ords to signal a reversal.
Long-term: Wait for a bull-trend on the Nasdaq or S&P 500
(primary cycle).
Colin Twiggs
Thought for the Day:
I never argue with the tape.
- Edwin Lefevre, Reminiscences of a Stock Operator (1923)
I never argue with the tape.
- Edwin Lefevre, Reminiscences of a Stock Operator (1923)
Back Issues
Click here to access the
Trading Diary Archives.
Back Issues
Access the Trading Diary Archives.

Author: Colin Twiggs is a former investment banker with almost 40 years of experience in financial markets. He co-founded Incredible Charts and writes the popular Trading Diary and Patient Investor newsletters.
Using a top-down approach, Colin identifies key macro trends in the global economy before evaluating selected opportunities using a combination of fundamental and technical analysis.
Focusing on interest rates and financial market liquidity as primary drivers of the economic cycle, he warned of the 2008/2009 and 2020 bear markets well ahead of actual events.
He founded PVT Capital (AFSL No. 546090) in May 2023, which offers investment strategy and advice to wholesale clients.