Incredible Charts version 4.0.0.6
Use Help >>About to check that you have the latest update. The new version offers:
-
A Price
Ratio (relative strength) indicator that applies to all
securities in a project.
When installing on the Indicator Panel, select "Apply to Project".
-
New Stock Screens
- Directional Movement (+DI, -DI and ADX)
- MACD above or below zero
- Volume Filter
- Equivolume with closing prices
Trading Diary
October 09, 2002
These extracts from my daily trading diary are
intended to illustrate the techniques used in short-term trading
and should not be interpreted as investment advice. Full terms
and conditions can be found at Terms
of Use .
USA
The Dow fell through 1998 support levels to close 2.9% down at
7286 on strong volume. The next support level is at 6936 from
1997.
The primary trend is down.
The Nasdaq Composite Index is already below 1997 levels and appears set to test the 1000 support level from 1996. The index closed down 15 points at 1114. The primary trend is down.
The S&P 500 recorded a 2.7% drop to close at 776, still above the 1997 low of 729.
The primary trend is down.
The Chartcraft NYSE Bullish % Indicator reflects a bear confirmed signal at 28% (October 8).
The primary trend is down.
The Nasdaq Composite Index is already below 1997 levels and appears set to test the 1000 support level from 1996. The index closed down 15 points at 1114. The primary trend is down.
The S&P 500 recorded a 2.7% drop to close at 776, still above the 1997 low of 729.
The primary trend is down.
The Chartcraft NYSE Bullish % Indicator reflects a bear confirmed signal at 28% (October 8).
Market sell-off
Investors sell General Electric and auto-makers Ford and GM, on concerns over earnings. Financial stocks are also down as pessimism abounds. (more)
Investors sell General Electric and auto-makers Ford and GM, on concerns over earnings. Financial stocks are also down as pessimism abounds. (more)
Yahoo!
The internet stock reported a 50% increase in third-quarter revenue compared to last year and earnings per share of 5 cents, ahead of expectations. (more)
Back Issues
The internet stock reported a 50% increase in third-quarter revenue compared to last year and earnings per share of 5 cents, ahead of expectations. (more)
Gold
New York: The spot gold price has recovered slightly, up 160 cents at $US 319.70.
New York: The spot gold price has recovered slightly, up 160 cents at $US 319.70.
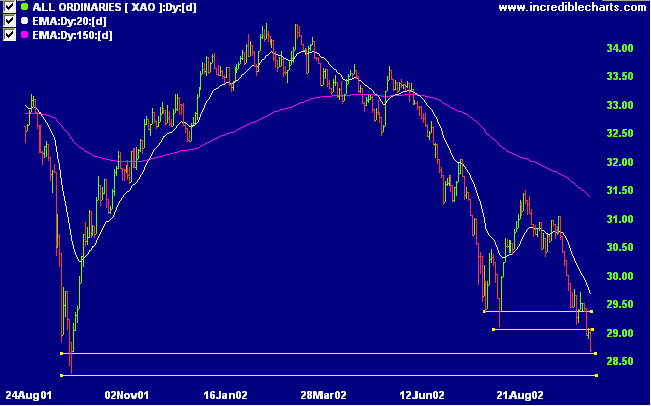
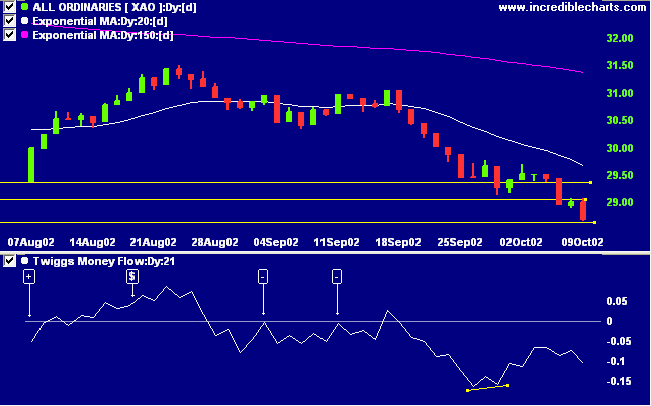
ASX Australia
The All Ordinaries tested support at 2867 from September
2001, closing down 31 points at 2870 on average volume. The
band of support is at 2867 to 2828. The primary trend is
down.
Slow Stochastic (20,3,3) and MACD (26,12,9) are below their
signal lines. Twiggs money flow signals distribution.
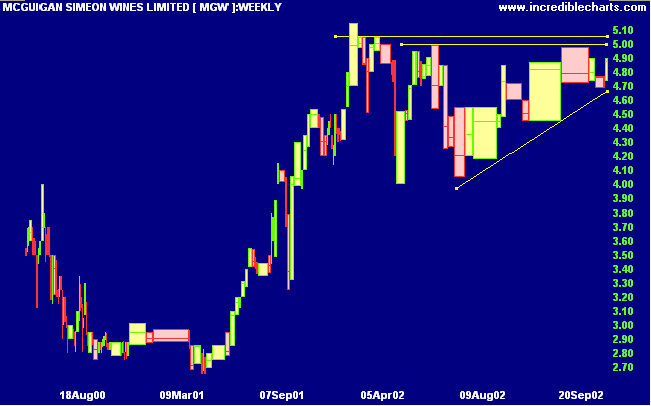
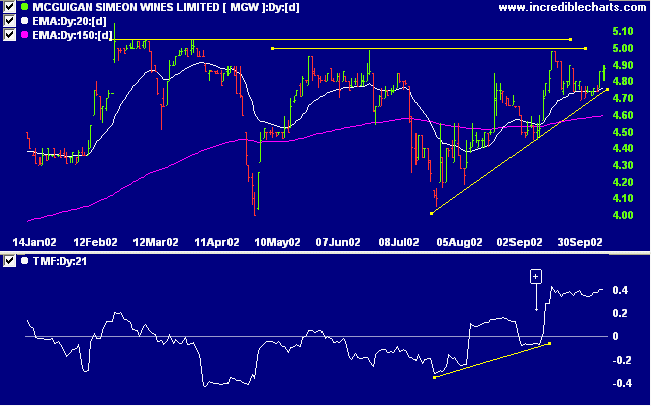
McGuigan Simeon Wines [MGW]
Last covered on September 18, MGW has formed an ascending triangle (some may interpret the pattern as a symmetrical triangle) after a stage 2 up-trend.
Last covered on September 18, MGW has formed an ascending triangle (some may interpret the pattern as a symmetrical triangle) after a stage 2 up-trend.
The daily chart shows equal tops at just below 5.00 and I
believe that this will the strongest resistance line. Twiggs
money flow signals strong accumulation while MACD shows a
bullish confirmation.
A break above 5.00 will be a strong bull signal. A tight stop
can be placed a few ticks below 5.00 or a wider stop placed
below the bottom trendline at 4.75, depending on the trading
objective.
Short-term: Short. The Slow Stochastic and MACD are below
their respective signal lines.
Medium-term: Wait for the All Ords to signal a reversal.
Long-term: Wait for a bull-trend on the Nasdaq or S&P 500
(primary cycle).
Colin Twiggs
Thought for the Day:
There are three things that you have to believe before you can trade successfully:
There are three things that you have to believe before you can trade successfully:
- You have to believe that it is actually possible to make money trading the markets.
- You have to believe that it is possible for you to make money trading the markets.
- You have to believe that you deserve to make money trading the markets.
Back Issues
Click here to access the
Trading Diary Archives.
Back Issues
Access the Trading Diary Archives.

Author: Colin Twiggs is a former investment banker with almost 40 years of experience in financial markets. He co-founded Incredible Charts and writes the popular Trading Diary and Patient Investor newsletters.
Using a top-down approach, Colin identifies key macro trends in the global economy before evaluating selected opportunities using a combination of fundamental and technical analysis.
Focusing on interest rates and financial market liquidity as primary drivers of the economic cycle, he warned of the 2008/2009 and 2020 bear markets well ahead of actual events.
He founded PVT Capital (AFSL No. 546090) in May 2023, which offers investment strategy and advice to wholesale clients.