Incredible Charts version 4.0.0.6
Use Help >>About to check that you have the latest update. The new version offers:
-
A Price
Ratio (relative strength) indicator that applies to all
securities in a project.
When installing on the Indicator Panel, select "Apply to Project".
-
New Stock Screens
- Directional Movement (+DI, -DI and ADX)
- MACD above or below zero
- Volume Filter
- Equivolume with closing prices
Trading Diary
October 08, 2002
These extracts from my daily trading diary are
intended to illustrate the techniques used in short-term trading
and should not be interpreted as investment advice. Full terms
and conditions can be found at Terms
of Use .
USA
The Dow gained 1% to close at 7501 on strong volume.
The primary trend is down.
The Nasdaq Composite Index rallied 10 points to close at 1129.
The primary trend is down.
The S&P 500 formed an outside day, closing up 11 points at 796.
The primary trend is down.
The Chartcraft NYSE Bullish % Indicator reflects a bear confirmed signal at 28% (October 7).
The primary trend is down.
The Nasdaq Composite Index rallied 10 points to close at 1129.
The primary trend is down.
The S&P 500 formed an outside day, closing up 11 points at 796.
The primary trend is down.
The Chartcraft NYSE Bullish % Indicator reflects a bear confirmed signal at 28% (October 7).
Bush intervenes in West Coast labor dispute
The markets were bouyed by the news that President Bush is seeking a court injunction to re-open West Coast ports. (more)
Back Issues
The markets were bouyed by the news that President Bush is seeking a court injunction to re-open West Coast ports. (more)
Gold
New York: The spot gold price declined 400 cents to $US 318.10.
New York: The spot gold price declined 400 cents to $US 318.10.
ASX Australia
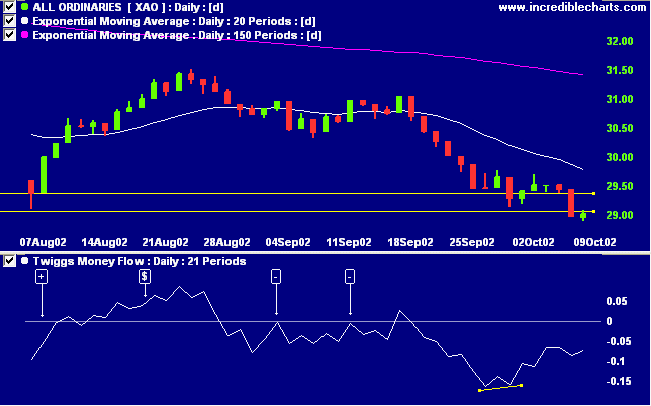
The All Ordinaries rose 5 points to close at 2901 on low
volume. The next band of support is at 2867 to 2828, from
September 2001. The primary trend is down.
Slow Stochastic (20,3,3) and MACD (26,12,9) are below their signal lines. Twiggs money flow is rising.
Slow Stochastic (20,3,3) and MACD (26,12,9) are below their signal lines. Twiggs money flow is rising.
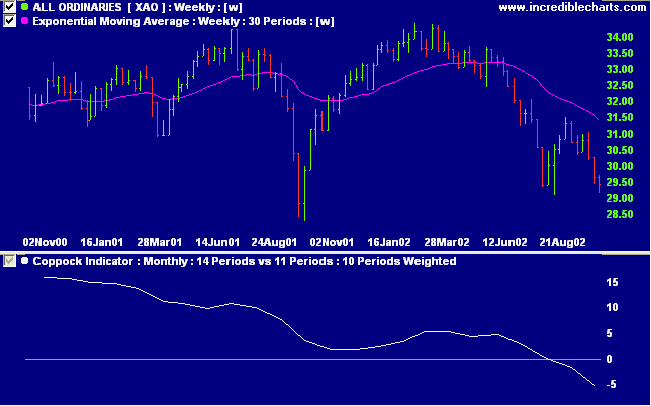
The long-term
Coppock indicator slopes downward.
Adelaide Bank [ADB]
Thanks to Rocky who drew my attention to ADB on the chart forum and provided some of the following analysis.
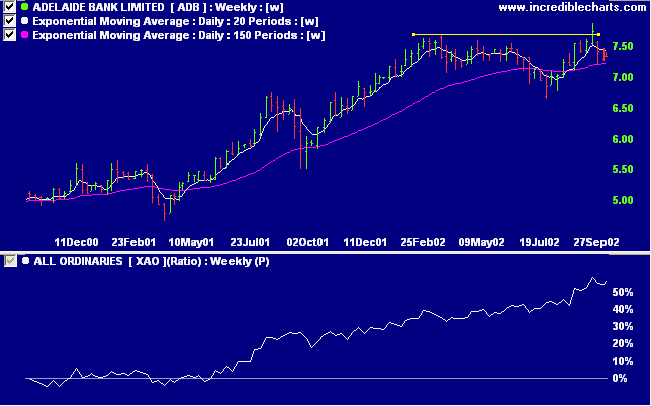
ADB is in a stage 2 up-trend with relative strength (price ratio: xao) rising.
Thanks to Rocky who drew my attention to ADB on the chart forum and provided some of the following analysis.
ADB is in a stage 2 up-trend with relative strength (price ratio: xao) rising.
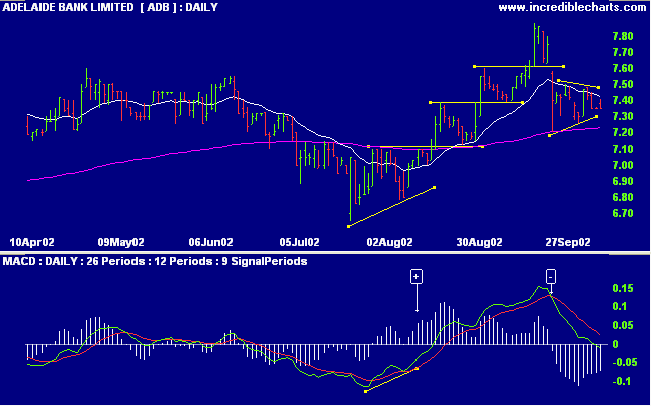
The daily chart shows a bullish
ascending triangle/pennant formed in early August after a
12-week secondary correction. MACD gave a bullish confirmation.
Twiggs money flow shows a bullish confirmation towards the end
of August.
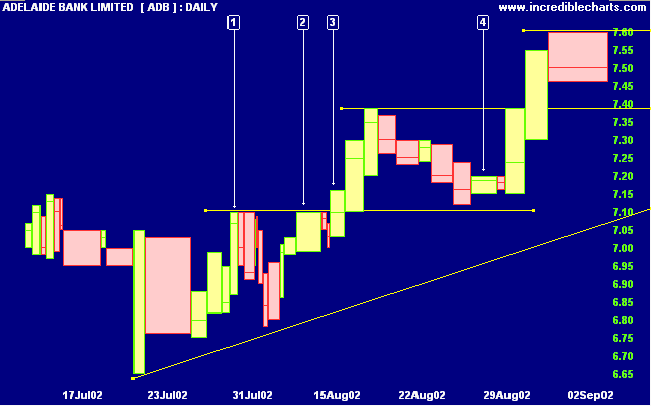
The equivolume
chart clearly shows support and resistance levels, with the
width of the bar depicting volume. Shaded areas on the bars
depict closing prices: the lighter shade is above the close in
an up-trend, and below the close in a down-trend.
The chart for July-August shows the ascending triangle formed after 2 equal highs at [1] and [2]. The 2-day correction after [2] is on weak volume, followed by a buy signal at [3] when stock rallies above the resistance level. The ideal entry point would be a buy-stop just above resistance at 7.10 with a stop-loss a few ticks below (a stop at the bottom edge of the triangle would be too wide).
The next correction ends above the 7.10 resistance level, confirming a strong trend. Accumulation is shown by the wider bar at [4]; increase your position when price rallies above the high.
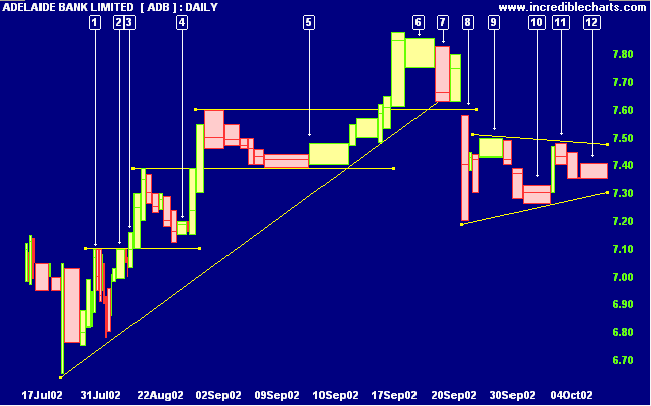
The next correction shows very strong accumulation/support at
[5]. Time for further buying when price clears the high of the
lowest bar. Move your stop up to a few ticks below the low, to
protect profits.
Distribution takes place at [6], near the new high. Take profits when price breaks below the low of [6], at [7]. Exit your remaining position when ADB gaps downward at [8].
Distribution takes place at [6], near the new high. Take profits when price breaks below the low of [6], at [7]. Exit your remaining position when ADB gaps downward at [8].
A further
pennant has formed in October, with resistance at [9] and
[11]. The pennant is normally a continuation pattern, but
strong support at [10] and [12] makes me cautious. A rally
above 7.48 could see resistance tested at 7.88, while a fall
below 7.30 may test support at 7.10 and 6.65.
Short-term: Short. The Slow Stochastic and MACD are below their
respective signal lines.
Medium-term: Wait for the All Ords to signal a reversal.
Long-term: Wait for a bull-trend on the Nasdaq or S&P 500
(primary cycle).
Colin Twiggs
Thought for the Day:
Everyone has his own specific vocation or mission in life to carry out a concrete assignment which demands fulfillment. Therein he cannot be replaced, nor can his life be repeated. Thus, everyone's task is as unique as is his specific opportunity to implement it.
Victor Frankl - Man's Search for Meaning
Back Issues
Click here to access the
Trading Diary Archives.
Back Issues
Access the Trading Diary Archives.

Author: Colin Twiggs is a former investment banker with almost 40 years of experience in financial markets. He co-founded Incredible Charts and writes the popular Trading Diary and Patient Investor newsletters.
Using a top-down approach, Colin identifies key macro trends in the global economy before evaluating selected opportunities using a combination of fundamental and technical analysis.
Focusing on interest rates and financial market liquidity as primary drivers of the economic cycle, he warned of the 2008/2009 and 2020 bear markets well ahead of actual events.
He founded PVT Capital (AFSL No. 546090) in May 2023, which offers investment strategy and advice to wholesale clients.