The Chart Forum software has been upgraded - contributors will now require a password to identify themselves.
Click Register on the Forum page to secure your username and password.
Select Profile to customize your settings.
Trading Diary
September 24, 2002
The primary cycle trends down.
The Nasdaq Composite Index rallied to test resistance at 1200 before slipping back to close 2 points down at 1182.
The primary trend is down.
The S&P 500 lost 14 points to close at 819. The July support level is 800.
The primary trend is down.
The Chartcraft NYSE Bullish % Indicator reflects a bear confirmed signal, falling to 36% (September 23).
On a split vote, Federal Reserve policy-makers resolve to leave rates unchanged. (more)
New York: The spot gold price tested the $US 328 level before closing at $US 326.10, up 340 cents.
The MACD (26,12,9) and Slow Stochastic (20,3,3) are below their signal lines. Twiggs money flow signals distribution.
The primary trend is down.

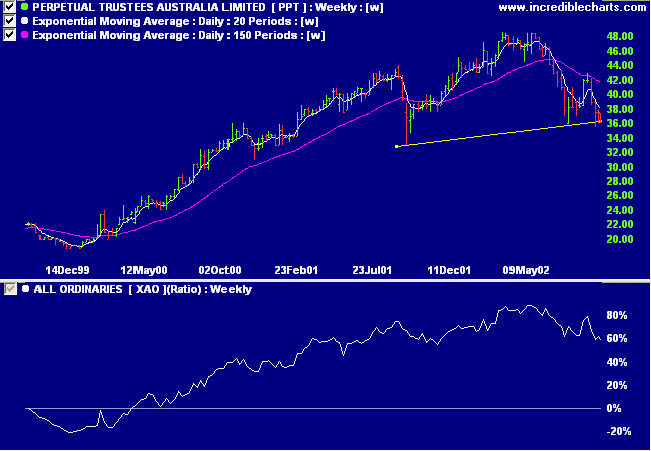
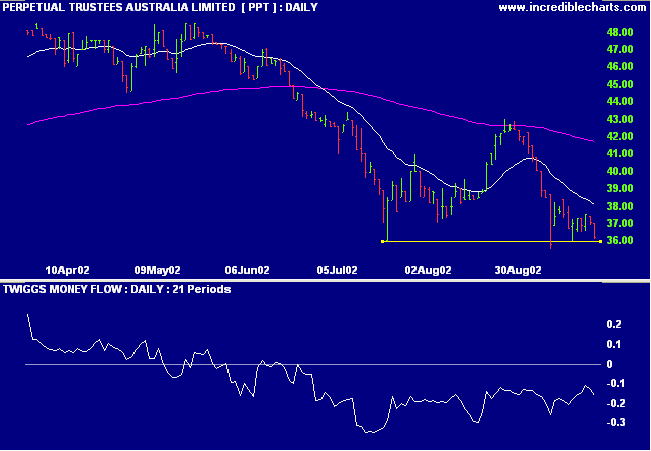
After a long stage 2 up-trend PPT appears to be forming a head and shoulders reversal pattern. A break below the neckline would have a target of 23.00 ( 36.00 - 48.00 + 35.00 ). Relative strength (price ratio: xao) has started to weaken.


Every decade has its characteristic folly, but the basic cause is the same:
people persist in believing that what has happened in the recent past
will go on happening into the indefinite future,
even while the ground is shifting under their feet.
- George J Church
Back Issues

Author: Colin Twiggs is a former investment banker with almost 40 years of experience in financial markets. He co-founded Incredible Charts and writes the popular Trading Diary and Patient Investor newsletters.
Using a top-down approach, Colin identifies key macro trends in the global economy before evaluating selected opportunities using a combination of fundamental and technical analysis.
Focusing on interest rates and financial market liquidity as primary drivers of the economic cycle, he warned of the 2008/2009 and 2020 bear markets well ahead of actual events.
He founded PVT Capital (AFSL No. 546090) in May 2023, which offers investment strategy and advice to wholesale clients.
