To insert an image in a chart forum posting:
-
Select a suitable chart display and mark
with trendlines and captions.
-
Select File >> Save Chart As
Image and save to a suitable folder (eg. My
Documents).
Use the standard bitmap width and height (608 x 451).
-
At a suitable point in your post to the
forum, type: \image{security}
(eg. if the chart is of Newscorp, type " \image{NCP} " or " \image{Newscorp}
-
When you select Preview/Post Message,
the position of your image will be highlighted with the words
"Your Image Here".
- Select Post this Message and you will be prompted for the image file. Use the Browse button to select the image file from 2. above, then click Upload.
Trading Diary
September 16, 2002
The primary cycle trends down.
The Nasdaq Composite Index weakened, falling 1.2% to close at 1275. The primary trend is down.
The S&P 500 closed almost unchanged, 2 points up at 891. The primary trend is down.
The Chartcraft NYSE Bullish % Indicator bull alert signal is at 46% (September 13).
With war on Iraq looming, defense stocks are in favor. (more)
Gold
The New York spot gold close is $US 317.20, up 70 cents.
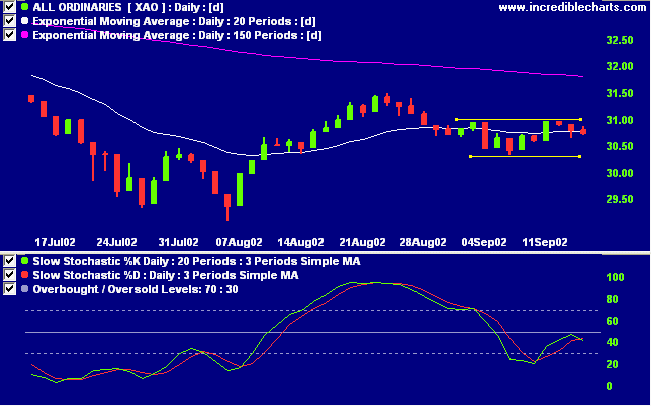
The markets appear to be going through a period of uncertainty, while the primary trend still is down.

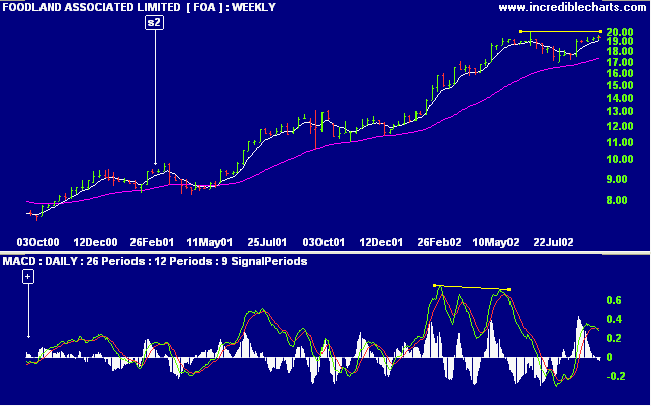
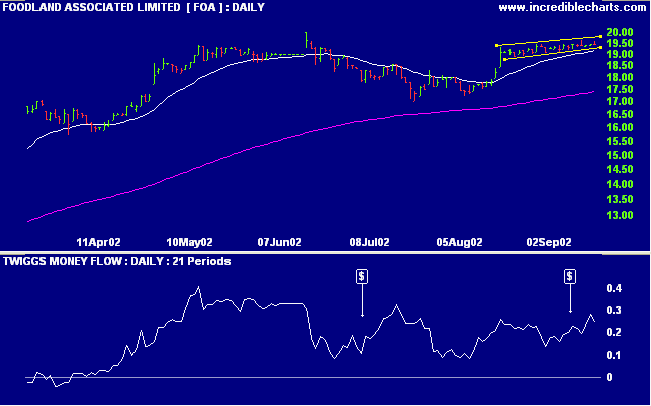
FOA has been in a stage 2 up-trend for the past 18 months. Price respected the 150-day moving average after a bearish divergence on MACD and now appears to be rallying towards the previous high of 20.00. Relative strength (price ratio: xao) is rising.


Two basic rules that apply to trading (and to life):
(1) If you don't bet you can't win; and
(2) If you lose all your chips, you can't bet.
- Larry Hite (from Jack Schwager's Market Wizards).
Back Issues

Author: Colin Twiggs is a former investment banker with almost 40 years of experience in financial markets. He co-founded Incredible Charts and writes the popular Trading Diary and Patient Investor newsletters.
Using a top-down approach, Colin identifies key macro trends in the global economy before evaluating selected opportunities using a combination of fundamental and technical analysis.
Focusing on interest rates and financial market liquidity as primary drivers of the economic cycle, he warned of the 2008/2009 and 2020 bear markets well ahead of actual events.
He founded PVT Capital (AFSL No. 546090) in May 2023, which offers investment strategy and advice to wholesale clients.
