Thank you for your input.
The consensus appears to be:
-
DI+ and DI- crossovers within x
number of days (where x is input by the
user).
-
ADX above or below x (as in %Price
Move - Minimum or Maximum values).
-
ADX crosses to above (or below) a value
x inserted by the user. For example: ADX crosses to
above 20.
- ADX today is x points above (or below) ADX from 5 days earlier.
You can view the discussion at ADX on the Chart Forum.
Trading Diary
September 13, 2002
The primary cycle trends down.
The Nasdaq Composite Index formed a closing-price reversal, rising 0.9% to close at 1291. The primary trend is down.
The S&P 500 closed 3 points up at 889. The primary trend is down.
The Chartcraft NYSE Bullish % Indicator bull alert signal is at 46% (September 12).
Disney is suffering from falling ratings at ABC Network and lower gates at its theme parks.
Gold
The New York close was down $US 2.20 at $US 316.50.
The primary trend is down.
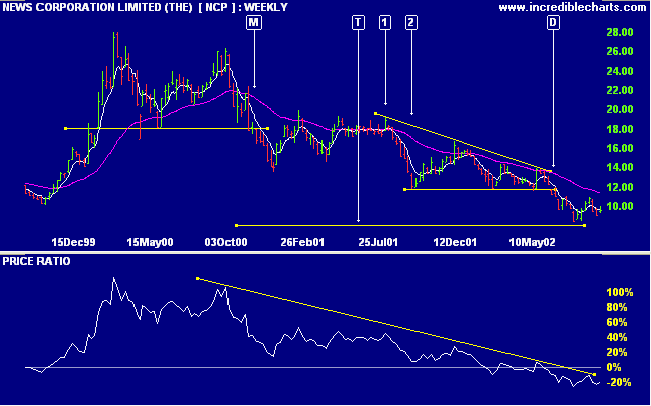
Picking the bottom on a falling stock is "like trying to catch a falling knife" - you may lose a few fingers. NCP has been in a stage 4 decline since completing a double top at [M]. It is now close to the measured objective at [T]. The stock subsequently completed a declining triangle at [D]. This has a measured objective of 4.40 ( 2 x 11.78 [2] - 19.16 [1] ). I am not suggesting that NCP is about to fall to $4.40, but there may still be further downside.
Stage changes are highlighted in bold.
- Energy [XEJ] - stage 1 (RS is rising)
- Materials [XMJ] - stage 4 (RS is rising)
- Industrials [XNJ] - stage 4
- Consumer Discretionary [XDJ] - stage 4
- Consumer Staples [XSJ] - stage 1 (RS is rising)
- Health Care [XHJ] - stage 4
- Property Trusts [XPJ] - stage 4
- Financial excl. Property Trusts [XXJ] - stage 4 (RS is rising)
- Information Technology [XIJ] - stage 4
- Telecom Services [XTJ] - stage 1 (RS is rising)
- Utilities [XUJ] - stage 2 (RS is rising)
A stock screen of the ASX 200 using % Price Move (1 month: +5%) has fallen to 57 stocks that have gained more than 5% in the last month. Notable sectors:
- Oil & Gas
- Broadcasting & Cable TV
The more I practice, the luckier I get.
- golf maestro Gary Player.
Back Issues

Author: Colin Twiggs is a former investment banker with almost 40 years of experience in financial markets. He co-founded Incredible Charts and writes the popular Trading Diary and Patient Investor newsletters.
Using a top-down approach, Colin identifies key macro trends in the global economy before evaluating selected opportunities using a combination of fundamental and technical analysis.
Focusing on interest rates and financial market liquidity as primary drivers of the economic cycle, he warned of the 2008/2009 and 2020 bear markets well ahead of actual events.
He founded PVT Capital (AFSL No. 546090) in May 2023, which offers investment strategy and advice to wholesale clients.