The third suggested Directional Movement filter is: When ADX turns up or turns down.
There are several ways to measure this:
-
ADX today is greater than ADX
yesterday. This may be too volatile, requiring some
form of smoothing (as in the options below).
-
ADX has risen for x days (or fallen
for x days ). If the user inserts a value of "1" day,
the result is the same as for "1." above. If they insert a
value of "2" days, the security will be included only if ADX
has increased on 2 consecutive days.
-
ADX today is x points above (or
below) ADX from 5 days earlier. This way we need only keep 2
fields on the database: ADX today and ADX from 5 days
ago.
-
ADX is the highest (or lowest) in the last 5
days.
- ADX crosses to above (or below) a value x inserted by the user. For example: ADX crosses to above 20.
Please post your preferences at ADX
on the Chart Forum.
(Note that where I mention "5 days" we may offer alternative
options such as 2 or 10 days).
Trading Diary
September 12, 2002
The primary cycle trends down.
The Nasdaq Composite Index dropped 2.7% to close at 1279. The primary trend is down.
The S&P 500 closed down 23 points at 886. The primary trend is down.
The Chartcraft NYSE Bullish % Indicator bull alert signal is at 46% (September 11).
The Federal Reserve Chairman says that the US economy has slowed and asks Congress to cut spending. (more)
Gold
Gold closed up $US 2.30 at $US 318.70 in New York.
The primary trend is down.


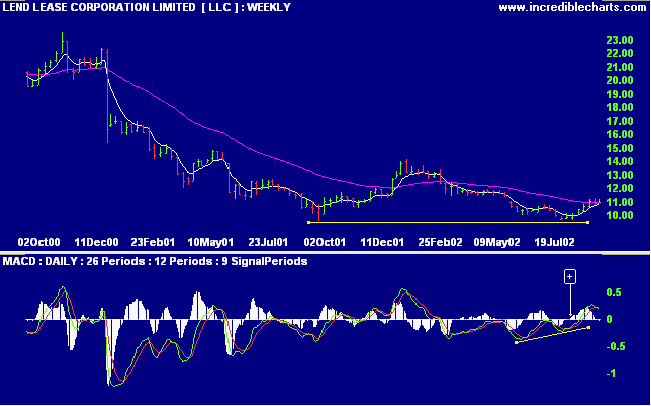
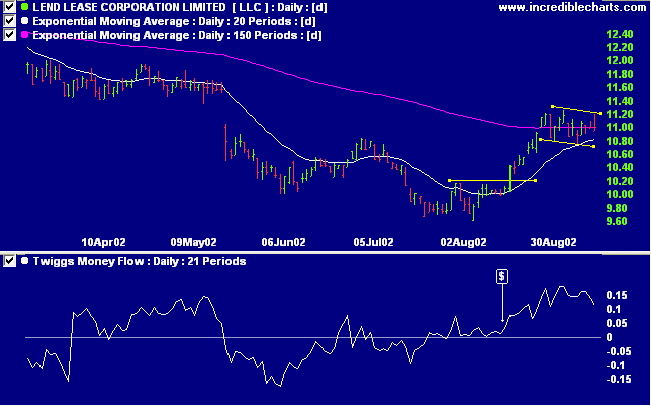
LLC is forming a stage 1 base after a lengthy stage 4 down-trend. The weekly chart shows strong support at 9.60 and the stock has now risen to the 150-day moving average after a bullish divergence on MACD.


We are what we repeatedly do.
Excellence, then, is not an act, but a habit.
- Aristotle.
Back Issues

Author: Colin Twiggs is a former investment banker with almost 40 years of experience in financial markets. He co-founded Incredible Charts and writes the popular Trading Diary and Patient Investor newsletters.
Using a top-down approach, Colin identifies key macro trends in the global economy before evaluating selected opportunities using a combination of fundamental and technical analysis.
Focusing on interest rates and financial market liquidity as primary drivers of the economic cycle, he warned of the 2008/2009 and 2020 bear markets well ahead of actual events.
He founded PVT Capital (AFSL No. 546090) in May 2023, which offers investment strategy and advice to wholesale clients.
