If you select an indicator (eg. Moving Averages, Bollinger bands or Parabolic SAR) that is displayed on the price chart, it will be displayed on whatever price chart (i.e. Daily, Weekly or Monthly) is currently in view , and not on the other two.
This enables you to select different MAs for the Daily, Weekly and monthly price charts. But it does create extra work if you want to add the same indicator to all three charts - rotate the chart view between Daily, Weekly and Monthly, clicking Save (">") each time on the Indicator Panel.
Trading Diary
September 4, 2002
The Nasdaq Composite Index closed up 2.2% at 1292. The primary trend is down.
The S&P 500 closed up 15 points at 893. The primary cycle is in a down-trend.
The Chartcraft NYSE Bullish % Indicator bull alert signal is at 46% (September 3).
August vehicle sales are up 13% on last year, leading General Motors to raise its earnings guidance for the third quarter and full year. (more)


The Reserve Bank is expected to leave interest rates unchanged. (more)
The grocery wholesaler reports first quarter sales are up 19%. (more)
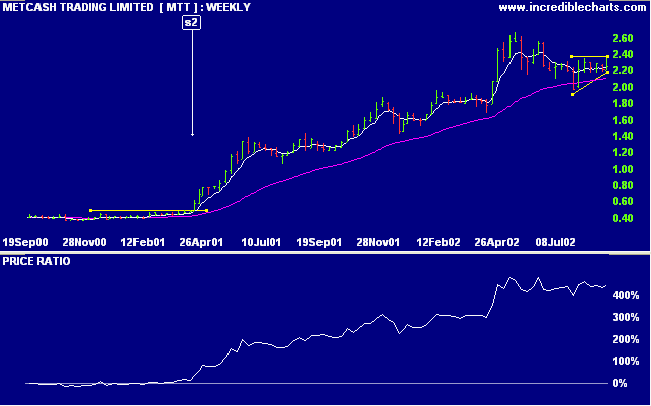
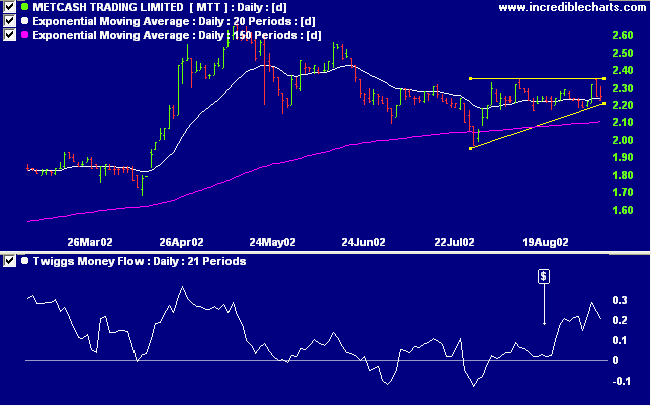
MTT has been in a stage 2 up-trend for the past 18 months, with rising Relative strength (price ratio:xao), before a 3-month correction back to the still rising 150-day MA.


The last temptation is the greatest treason,
To do the right deed for the wrong reason.
- T.S. Eliot
Back Issues

Author: Colin Twiggs is a former investment banker with almost 40 years of experience in financial markets. He co-founded Incredible Charts and writes the popular Trading Diary and Patient Investor newsletters.
Using a top-down approach, Colin identifies key macro trends in the global economy before evaluating selected opportunities using a combination of fundamental and technical analysis.
Focusing on interest rates and financial market liquidity as primary drivers of the economic cycle, he warned of the 2008/2009 and 2020 bear markets well ahead of actual events.
He founded PVT Capital (AFSL No. 546090) in May 2023, which offers investment strategy and advice to wholesale clients.
