See the What's New page for details.
To check that you have the current version, select Help >> About .
Trading Diary
August 30, 2002
The Nasdaq Composite reversed yesterday's gain, closing down 1.6% at 1314. The inside day signals uncertainty. The secondary rally is intact, while the primary cycle is in a down-trend.
The S&P 500 closed 1 point down at 917. A second doji
signals uncertainty.
The primary trend is down.
The Chartcraft NYSE Bullish % Indicator bull alert signal is at 46% (August 29).
The market will be closed Monday for Labor Day.
The Fed chairman citing past examples, suggested that only a sharp increase in short-term rates would have sufficient economic impact to check a stock market bubble...and could trigger a recession.
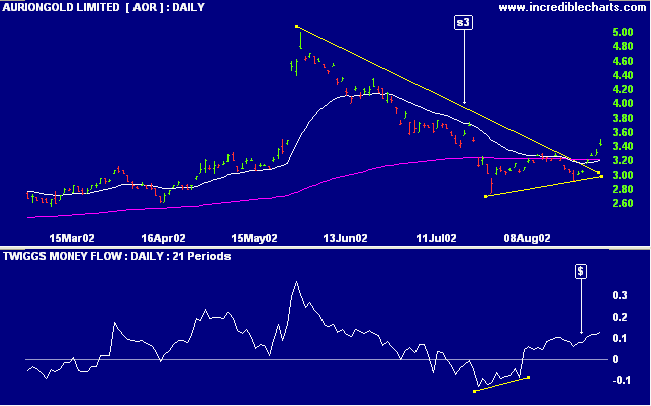
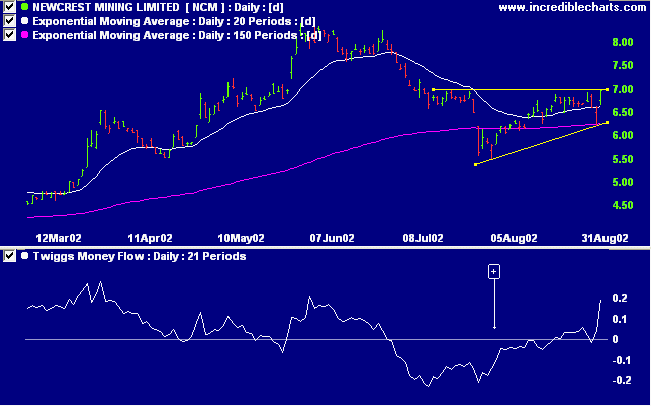
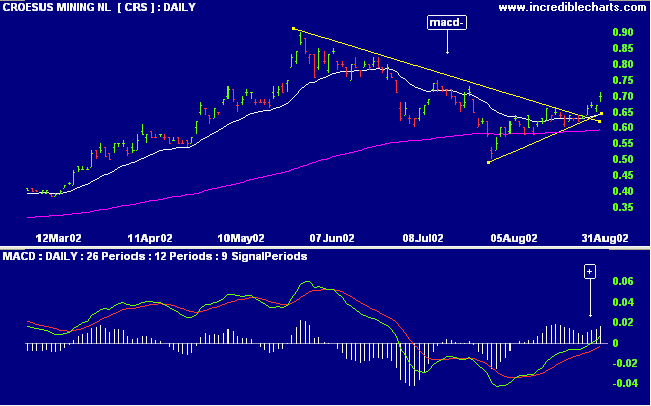
Several gold stocks have formed triangle patterns after the recent down-trend. Possibly because spot gold has formed a higher August trough after a sharply lower trough in July.
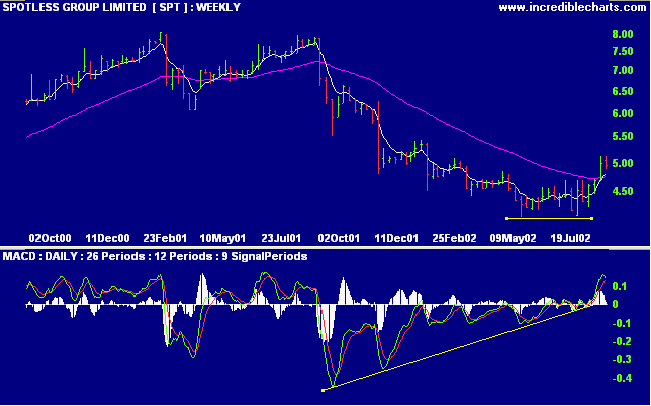
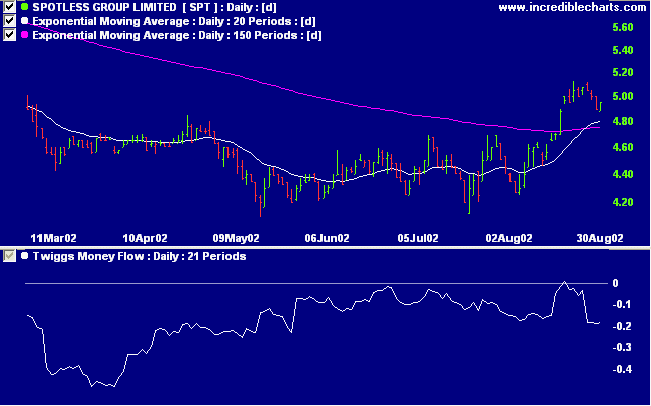
SPT is forming a stage 1 base with the 150-day moving average leveling off and MACD signaling a strong bullish divergence.
Stage changes are highlighted in bold.
- Energy [XEJ] - stage 1 (RS is rising)
- Materials [XMJ] - stage 4
- Industrials [XNJ] - stage 4
- Consumer Discretionary [XDJ] - stage 4
- Consumer Staples [XSJ] - stage 4 (RS is rising)
- Health Care [XHJ] - stage 4
- Property Trusts [XPJ] - stage 4
- Financial excl. Property Trusts [XXJ] - stage 4
- Information Technology [XIJ] - stage 4
- Telecom Services [XTJ] - stage 1
- Utilities [XUJ] - stage 2 (RS is rising)
A stock screen of the ASX 200 using % Price Move (1 month: +5%) shows 77 stocks that have gained more than 5% in the last month. Notably:
- Banks
- Construction Materials
- Real Estate Investment Trusts
The trouble with using experience as a guide is that the final exam comes before the first lesson.
Back Issues

Author: Colin Twiggs is a former investment banker with almost 40 years of experience in financial markets. He co-founded Incredible Charts and writes the popular Trading Diary and Patient Investor newsletters.
Using a top-down approach, Colin identifies key macro trends in the global economy before evaluating selected opportunities using a combination of fundamental and technical analysis.
Focusing on interest rates and financial market liquidity as primary drivers of the economic cycle, he warned of the 2008/2009 and 2020 bear markets well ahead of actual events.
He founded PVT Capital (AFSL No. 546090) in May 2023, which offers investment strategy and advice to wholesale clients.