Trading Diary
July 29, 2002
The Chartcraft NYSE Bullish % Indicator has a
reading of 24% (July 26). See
Bullish % Index for more details.
Leading companies - General Motors has commenced a secondary
rally while Fedex (which has stronger relative strength) still
trends down.
The Nasdaq Composite jumped 5.8% to close at 1335, another potential follow-through. Primary and secondary cycles are still in a down-trend.
The S&P 500 climbed 46 points to close at 898.
Primary cycle trends downwards but the secondary cycle has
started a rally.
Trading Diary
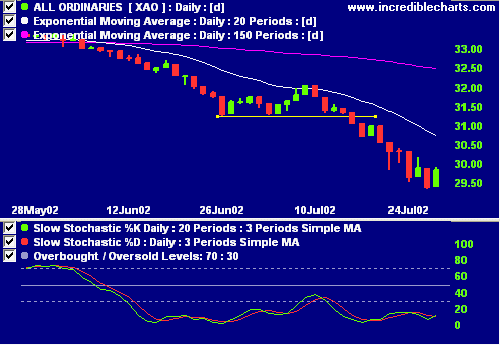
The primary cycle and secondary cycles trend down. The next
support level is 2828, from September 2001
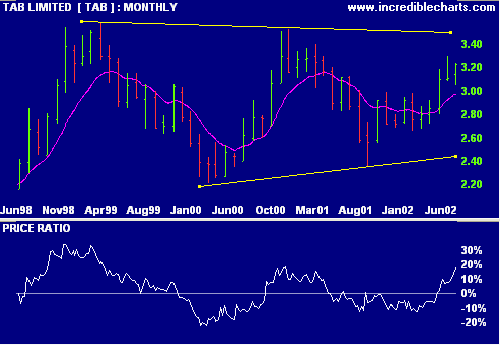
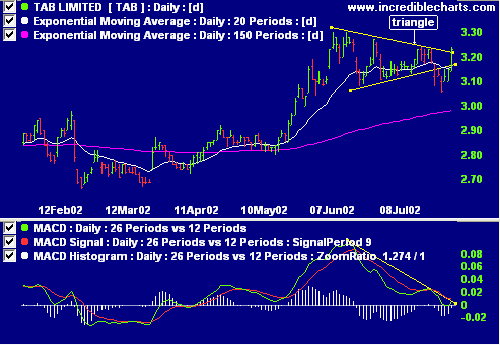
The NSW totalisator and wagering business is forming a long-term triangle on the monthly chart, with improving relative strength (price ratio: xao). The rally during May 2002 was supported by a share buy-back of 9.8% of share capital so we will need to analyze subsequent performance.
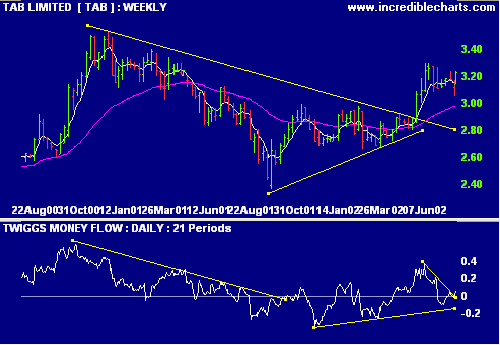
The daily chart shows a further triangle with a break downwards during last week's bear market decline. This has been followed by a rally to match the recent high. A break above this level, supported by strong volume, would have a target of 3.44, but MACD will need to reverse.
In a narrow market, when prices are not getting anywhere to speak of but move in a narrow range, there is no sense in trying to anticipate what the next big movement is going to be - up or down.
- Edwin Lefevre.
Back Issues

Author: Colin Twiggs is a former investment banker with almost 40 years of experience in financial markets. He co-founded Incredible Charts and writes the popular Trading Diary and Patient Investor newsletters.
Using a top-down approach, Colin identifies key macro trends in the global economy before evaluating selected opportunities using a combination of fundamental and technical analysis.
Focusing on interest rates and financial market liquidity as primary drivers of the economic cycle, he warned of the 2008/2009 and 2020 bear markets well ahead of actual events.
He founded PVT Capital (AFSL No. 546090) in May 2023, which offers investment strategy and advice to wholesale clients.
