Trading Diary
July 24, 2002
The Chartcraft NYSE Bullish % Indicator has now entered oversold territory. See Bullish % Index for more details.
The Nasdaq Composite rose 5% to close at 1290. Primary and secondary cycles are in a down-trend.
The S&P 500 rallied 45 points to close at 843.
Primary and secondary cycles trend downwards.
The S&P 500 formed a strong key reversal signal, while the Dow formed a weaker pivot point reversal and the Nasdaq just failed to complete a reversal signal. These are short-term signals and it will take at least a week before we know whether this is a "V" bottom, as in September 2001, or a "sucker rally". The major bottoms in the past 40 years were:
1962 - ascending triangle
1970 - ascending triangle
1974 - double bottom
1980 - ascending triangle
1988 - ascending triangle (long)
1990 - symmetrical triangle
1998 - double bottom
2001 - "V" bottom
Bears will remind us that in 1985 the dividend yield on the Dow was 4.5%. This fell to 3.0% in 1987 before retreating to 4.5% after the crash. In 2002, the yield has just recovered above 2% after falling to almost 1.5%.
Trading Diary
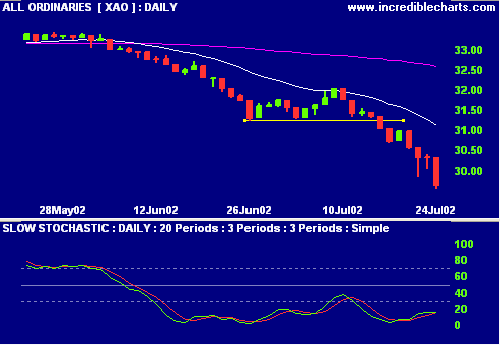
The primary cycle and secondary cycles trend down. The next
support level is 2828, from September 2001
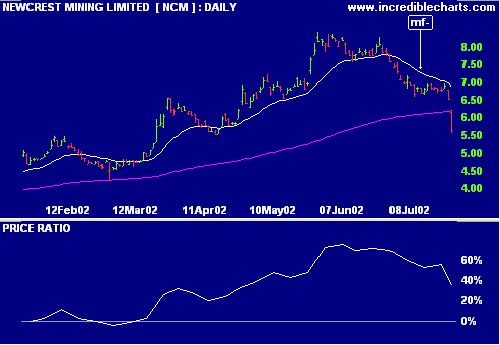
Newcrest Mining [NCM] has experienced even steeper falls with declining relative strength (price ratio: xao) and MACD, and exponentially-smoothed money flow falling sharply.
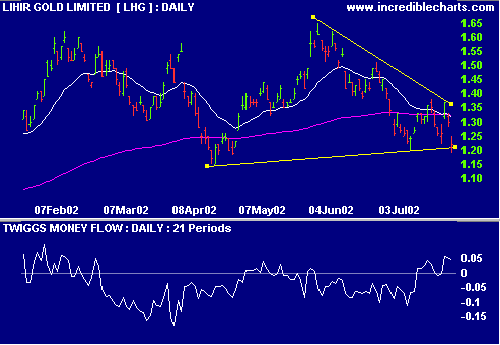
Lihir Gold [LHG] is threatening to break out on the downside of a triangle. Relative strength (price ratio: xao) and MACD are weak but exponentially-smoothed money flow still shows accumulation.
One of the most helpful things that anybody can learn is to give up trying to catch the last eighth - or the first.
These two are the most expensive eighths in the world. - Edwin Lefevre.
Back Issues

Author: Colin Twiggs is a former investment banker with almost 40 years of experience in financial markets. He co-founded Incredible Charts and writes the popular Trading Diary and Patient Investor newsletters.
Using a top-down approach, Colin identifies key macro trends in the global economy before evaluating selected opportunities using a combination of fundamental and technical analysis.
Focusing on interest rates and financial market liquidity as primary drivers of the economic cycle, he warned of the 2008/2009 and 2020 bear markets well ahead of actual events.
He founded PVT Capital (AFSL No. 546090) in May 2023, which offers investment strategy and advice to wholesale clients.