S&P 500 and Nasdaq consolidate
By Colin Twiggs
May 28th, 2012 1:00 a.m. ET (5:00 p.m. AET)
These extracts from my trading diary are for educational purposes and should not be interpreted as investment or trading advice. Full terms and conditions can be found at Terms of Use.
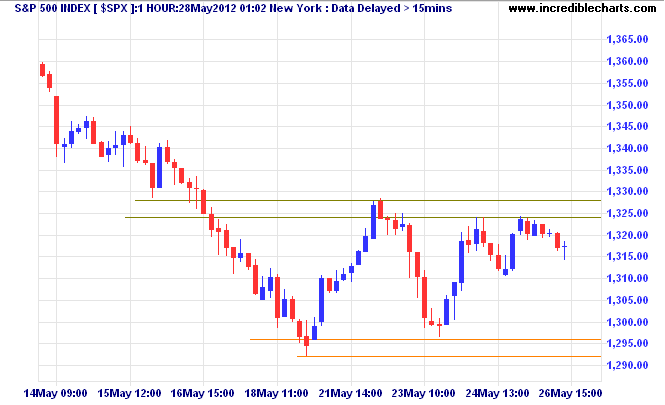
The S&P 500 finished the week having twice respected support at the 50% Fibonacci retracement level of 1292/1296 on the hourly chart. Recovery above resistance at 1330 would indicate the end of the secondary correction.

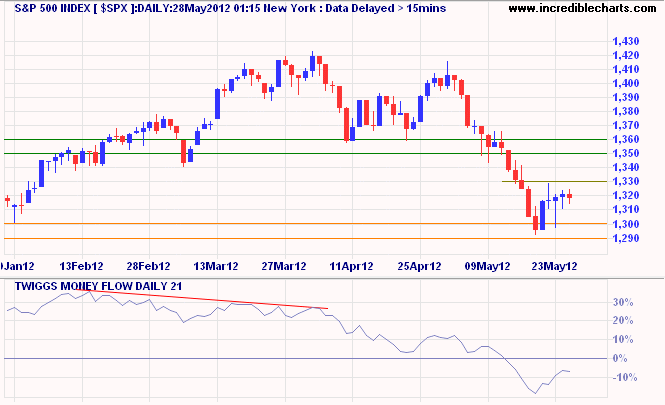
21-Day Twiggs Money Flow below zero, however, continues to warn of selling pressure. Reversal below 1290 remains likely and would test primary support at 1150.

* Target calculation: 1350 - ( 1400 - 1350 ) = 1300
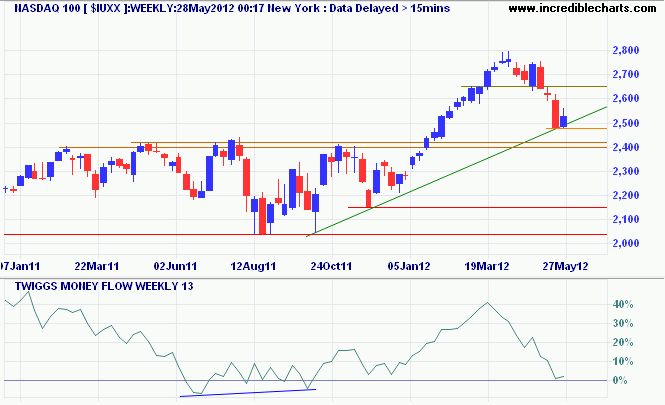
On the weekly chart, the Nasdaq 100 continues to test support at 2500. Breach of the rising trendline would warn that the primary up-trend is weakening. The sharp fall on 13-week Twiggs Money Flow indicates selling pressure and reversal below zero would suggest a primary down-trend.

What a cruel thing is war: to separate and destroy families and friends, and mar the purest joys and happiness God has granted us in this world; to fill our hearts with hatred instead of love for our neighbors, and to devastate the fair face of this beautiful world.
~ Robert E. Lee, letter to his wife (1864)
