Gold tests $1800/ounce
By Colin Twiggs
February 16th, 2012 2:30 a.m. ET (6:30 p:m AET)
These extracts from my trading diary are for educational purposes and should not be interpreted as investment or trading advice. Full terms and conditions can be found at Terms of Use.
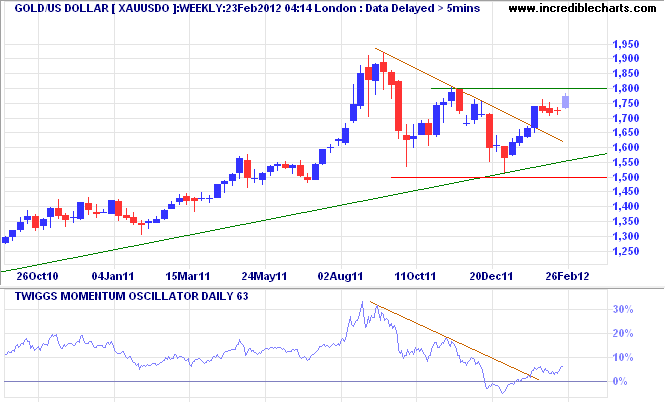
Spot gold is testing resistance at $1800/ounce on the weekly chart after completing a small flag to signal continuation of the up-trend. Breakout would signal a primary advance to $2100*. Respect of the zero line by 63-day Twiggs Momentum would strengthen the signal.

* Target calculation: 1800 + ( 1800 - 1500 ) = 2100
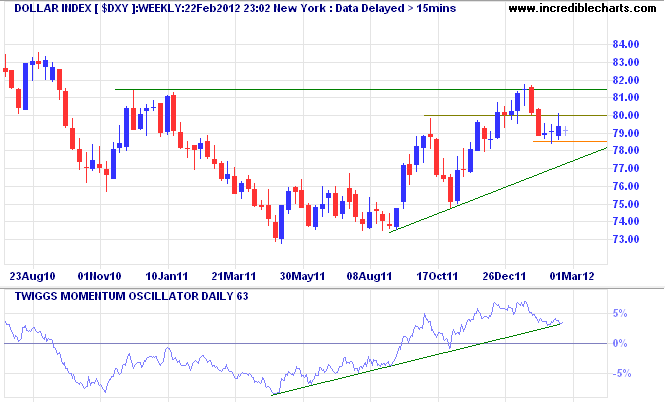
The US Dollar Index remains weak as inflation expectations rise. Failure of medium-term support at 78.50 would warn of trend weakness, while recovery above 80.00 would indicate trend strength. Target for a breakout above 81.50 would be 85.00*.

* Target calculation: 80 + ( 80 - 75 ) = 85
Geniuses and prophets do not usually excel in professional learning, and their originality, if any, is often due precisely to the fact that they do not.
~ Joseph Schumpeter: Capitalism, Socialism and Democracy
