What a real bounce looks like
By Colin Twiggs
August 15th, 2011 10:00 p.m. ET (12:00 midday AET)
These extracts from my trading diary are for educational purposes and should not be interpreted as investment or trading advice. Full terms and conditions can be found at Terms of Use.
New Format
I will post fresh analysis to the Gold, Stocks & Forex trading blog every day. Posts of no more than a few paragraphs are easier to read and the Comments section on each page will hopefully encourage greater interaction with readers. Existing Trading Diary summaries will continue, but readers can also elect to receive every post or daily/weekly updates.
Thank you for your support and I hope you enjoy the new format.
What a real bounce looks like
Question from Flint:
If this is an example of a dead cat bounce then what would we look for in a real bounce....
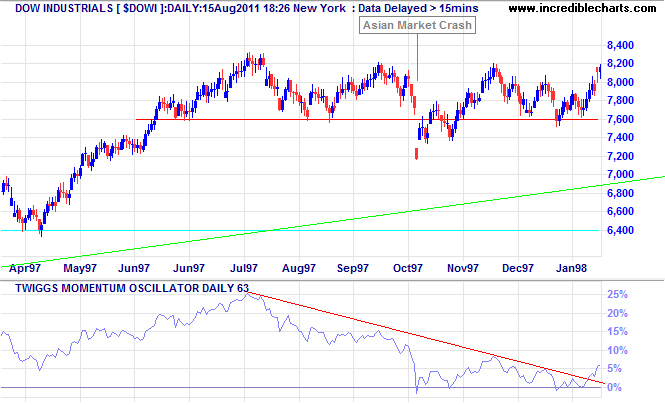
The best example I can find is the mini-crash of October 1997. The Dow gapped down sharply following a fall in Asian markets, but met with strong buying support the next day. The total correction of 12% did not reach the 6400 level from start of the year. The long-term rising trendline was not tested and 63-Day Twiggs Momentum declined but failed to break below zero. Volume doubled in the week following the crash, confirming buying support.
India Singapore
India's Sensex Index closed lower Monday on average volume. 13-Week Twiggs Money Flow continues below zero, warning of selling pressure. Breakout below Tuesday's low of 16500 would confirm the decline to 16000*.
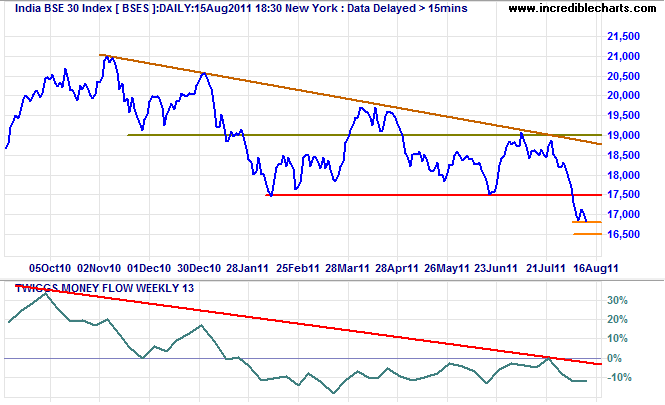
* Target calculation: 17500 - ( 19000 - 17500 ) = 16000
The Singapore Straits Times Index fared better. Recovery above 2900 would indicate a bear rally, but resistance at 3000 is expected to hold.
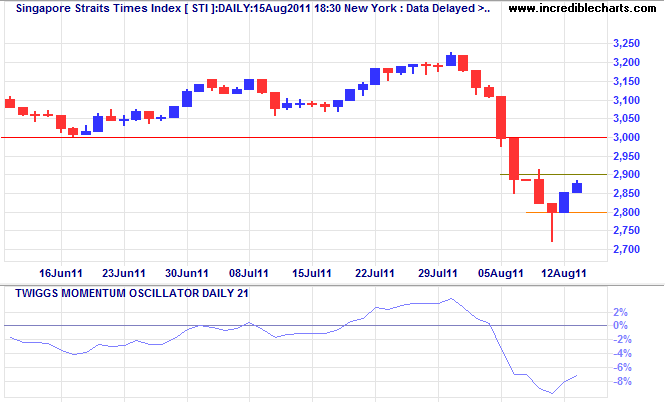
* Target calculation: 2800 - ( 3000 - 2800 ) = 2600
China Momentum v. Money Flow
The Shanghai Composite displays a similar bullish divergence on 21-day Twiggs Money Flow to the DJ Shanghai Index. Follow-through above 2660 is likely, but resistance at 2820 is expected to hold.
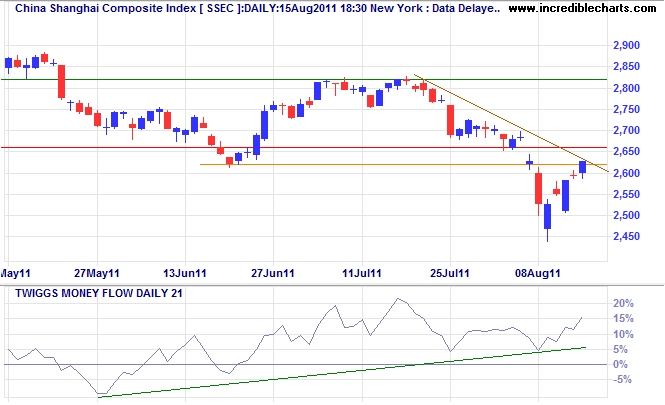
* Target calculation: 2600 - ( 2800 - 2600 ) = 2400
The Hang Seng Index shows a similar (Twiggs Money Flow) bullish divergence to the Shanghai Composite, but both display a sharp fall on 63-day Momentum below zero....
Kiwi 50 face strong selling pressure
The NZ50 Index is retracing to test 3300, but 13-week Twiggs Money Flow deep below zero warns of strong selling pressure. Respect of resistance is likely, followed by another test of support at 3100.
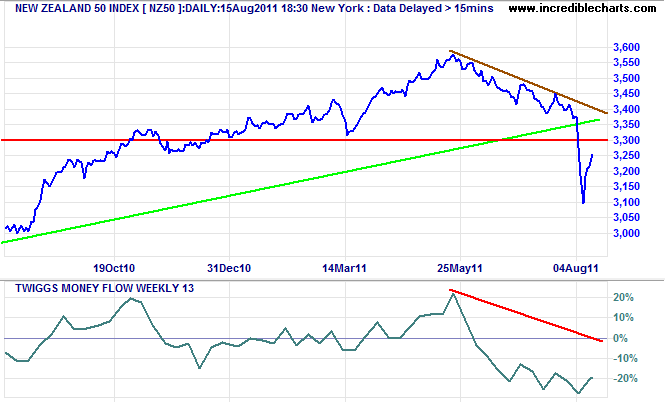
* Target calculation: 3300 - ( 3600 - 3300 ) = 3000
Men who can both be right and sit tight are uncommon. I found it one of the hardest things to learn.
~ Jesse Livermore in Reminiscences of a Stock Operator by Edwin Lefevre.
