Gold and silver suggest weaker dollar
By Colin Twiggs
July 21st, 2011 4:00 a.m. ET (6:00 p:m AET)
These extracts from my trading diary are for educational purposes and should not be interpreted as investment or trading advice. Full terms and conditions can be found at Terms of Use.
Gold
Spot gold is testing the upper trend channel on the weekly chart. Target for breakout from the triangle formation is 1650*.
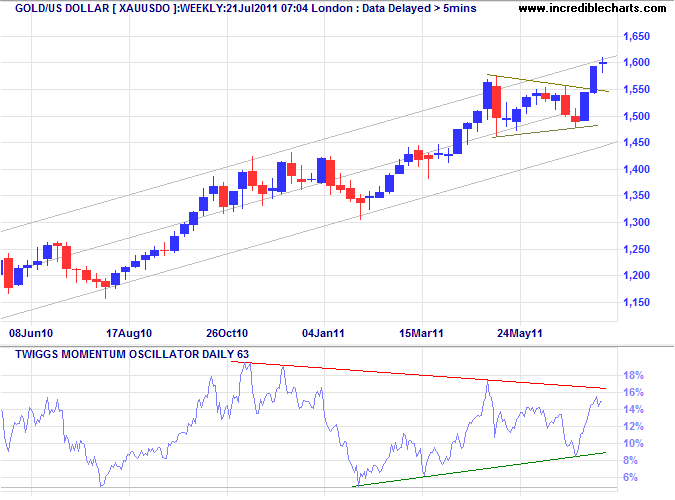
* Target calculation: 1550 + ( 1575 - 1475 ) = 1650
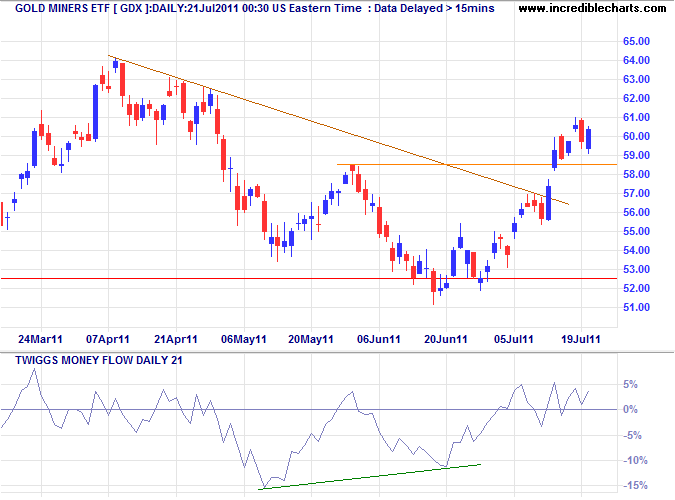
Market Vectors Gold Miners ETF (GDX), based on the $GDM index, broke through resistance at 58.50, suggesting another test of 64. Follow-through above 61 would confirm. Bullish divergence on 21-day Twiggs Money Flow indicates buying pressure.
Silver
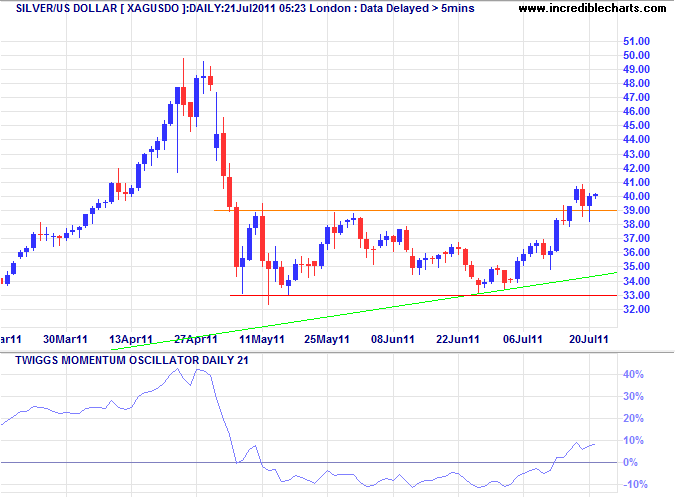
Silver is testing the new support level at $39, after a breakout. Long tails on recent candles indicate buying support. Follow through above $41 would confirm the advance to $50 — a bullish sign for gold.
US Dollar Index
Rising gold and silver suggest a weak dollar. The Dollar Index is lately dominated by tall shadows and red candles, indicating selling pressure. Failure of support at $74.20 would test primary support at 73, warning of another down-swing with a target of 70*. But narrow oscillation of 21-day Momentum around the zero line indicates no strong trend as yet.
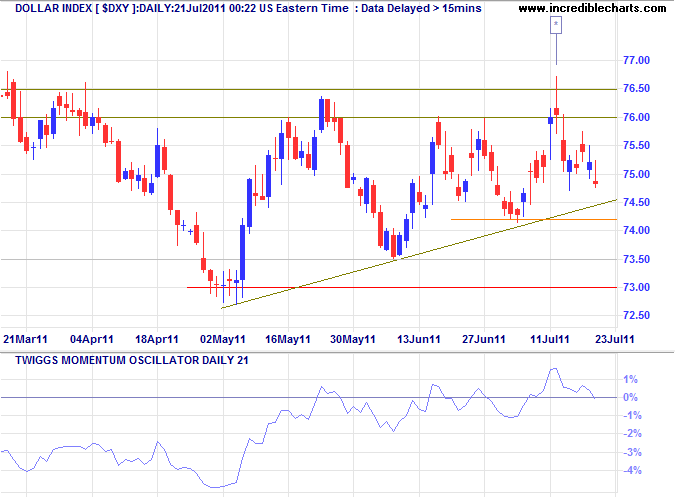
* Target calculation: 74 - ( 76.5 - 72.5 ) = 70
Commodities
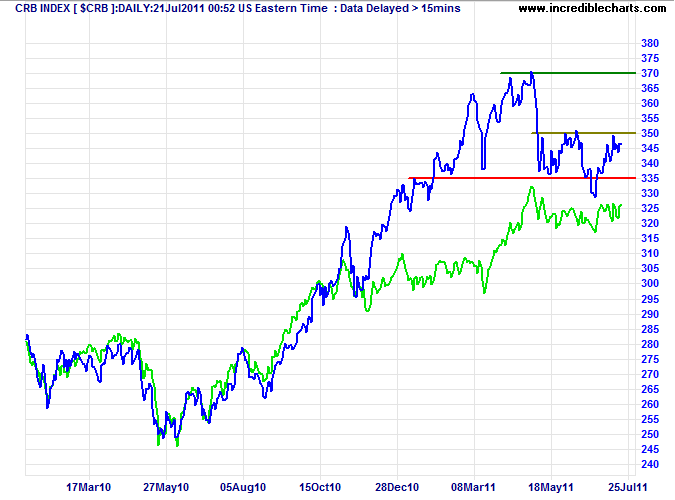
The CRB Commodities Index is testing resistance at 350 on the weekly chart, but breakout could merely be a broadening wedge formation. The subsequent retracement should provide further evidence. A weakening dollar would boost commodities prices. The Australian dollar, which closely tracked the index for some time, is also stuck in a consolidation.
Crude Oil
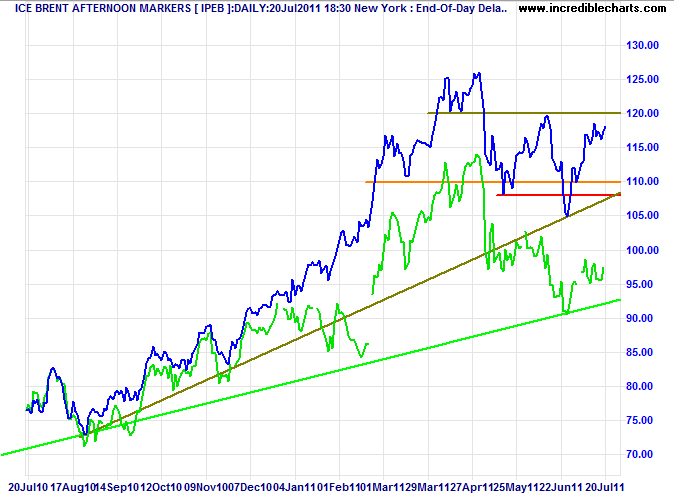
Brent crude is similarly testing resistance at $120. Breakout could merely indicate a broadening wedge formation and we will have to wait for the next retracement to provide further evidence. Renewal of crude's primary up-trend would boost gold, but add another nail in the coffin of the recovery. Nymex Crude (green) continues to diverge from Brent prices, but this difference should not be permanent and is likely to last no longer than the election year.
Euro
The euro is headed for a test of $1.46, but 21-day Momentum oscillating in a narrow range around zero shows no clear trend. The descending triangle formation warns of a reversal.
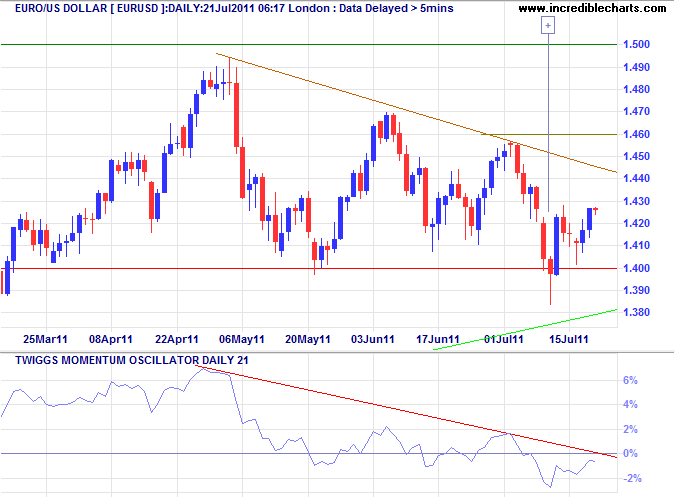
* Target calculation: 1.46 + ( 1.50 - 1.40 ) = 1.56 or 1.41 - ( 1.50 - 1.40 ) = 1.31
Swiss Franc
The Swiss franc is testing support at $1.20, and the lower trend channel, against the dollar. Bearish divergence on 21-day Momentum warns of a correction. Failure of support would strengthen the signal, while respect would suggest a rally to the upper channel.
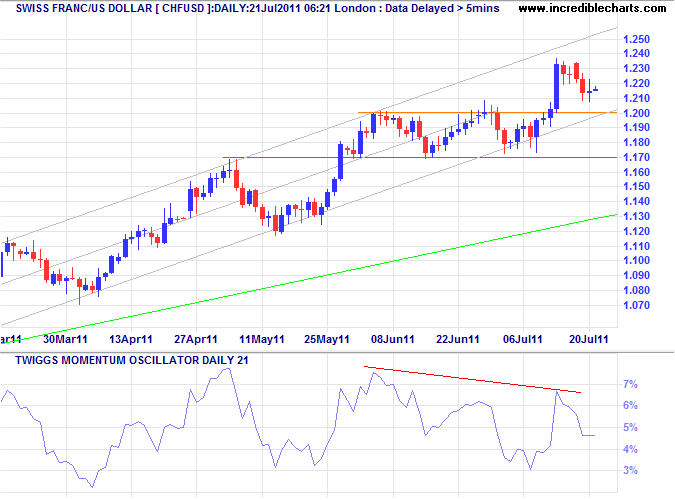
* Target calculation: 1.00 + ( 1.00 - 0.80 ) = 1.20
UK Pound Sterling
The pound is testing resistance at the descending trendline ($1.62). Breakout would indicate the correction is over, signaling an advance to $1.67. Reversal below $1.59 is unlikely, but would signal a decline to $1.53*.
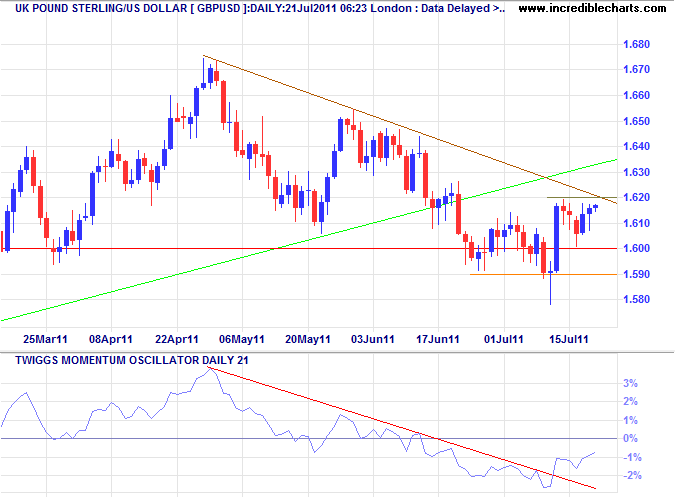
* Target calculation: 1.60 - ( 1.67 - 1.60 ) = 1.53
Japanese Yen
The dollar is testing short-term support at ¥78.50, failure would signal a decline to ¥75*. Weak 21-day Momentum, holding below zero, confirms the down-trend.
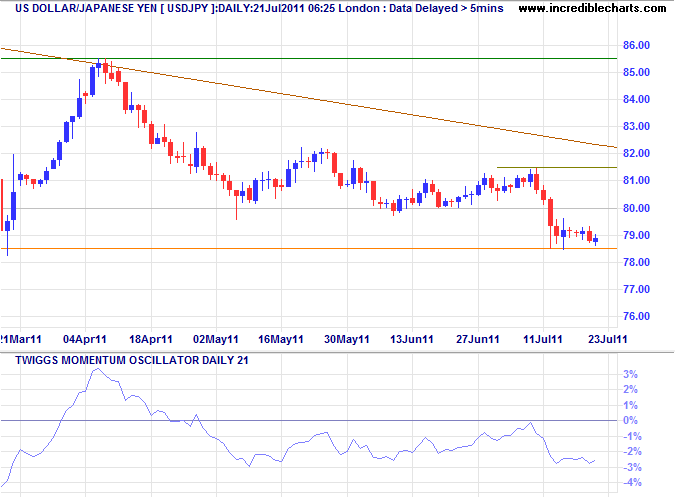
* Target calculation: 80 - ( 85 - 80 ) = 75
Canadian Dollar
The Loonie continues to edge upwards against the dollar. Breakout above resistance at $1.06 on the weekly chart would test the upper trend channel at $1.09*.
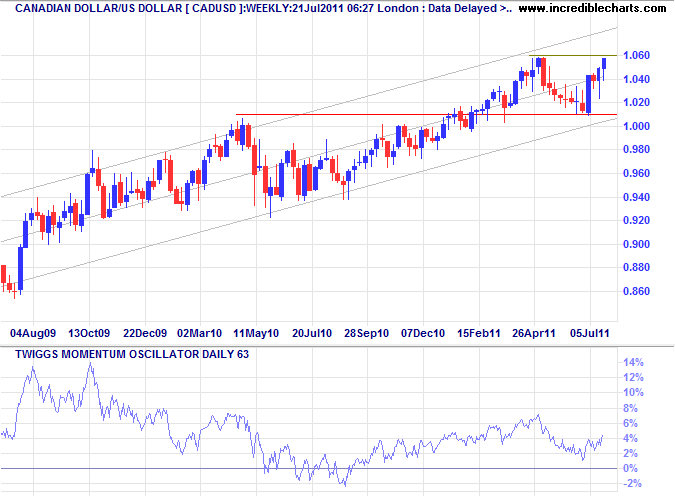
* Target calculation: 1.06 + ( 1.06 - 1.03 ) = 1.09
New Zealand Dollar
The Aussie dollar is in a primary down-trend against its Kiwi counterpart. The current decline has a target of the June 2010 low at $1.22*. A sharp fall of 63-day Momentum below zero confirms the down-trend.
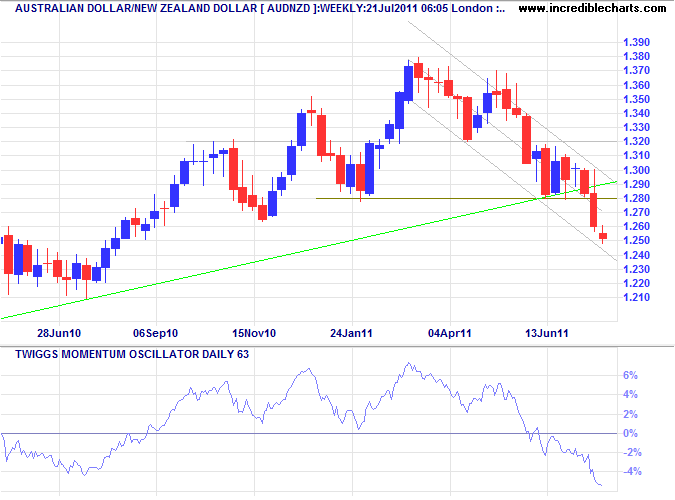
* Target calculation: 1.30 - ( 1.38 - 1.30 ) = 1.22
Australian Dollar
The Aussie dollar continues to test resistance at $1.080 against the greenback. Breakout would signal an advance to $1.12*, but another test of $1.04 is equally likely. Narrow oscillation of 21-day Momentum around zero indicates no clear trend.
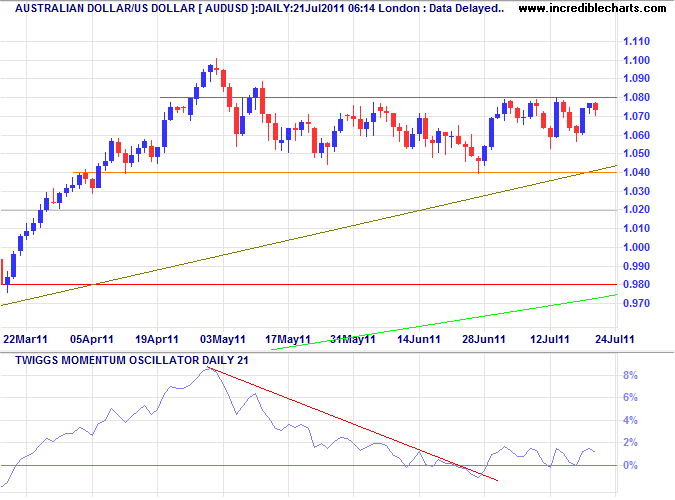
* Target calculation: 1.08 + ( 1.08 - 1.04 ) = 1.12
Happy people plan actions, they don't plan results.
~
Dennis Wholey (1937)
