Gold Triangle
By Colin Twiggs
August 25, 2009 2:00 a.m. ET (4:00 p.m. AET)
These extracts from my trading diary are for educational purposes and should not be interpreted as investment or trading advice. Full terms and conditions can be found at Terms of Use.
US Dollar Index
The US Dollar Index is edging lower, now consolidating between 77.50 and 79.50, astride the primary support level. Declining average true range warns of shrinking volatility. Breakout accompanied by rising ATR would indicate a new advance or decline, depending on direction of the breakout. Downward breakout is more likely, because of the primary down-trend and recent breakout, and would offer a target of 74* — signaling stronger gold and oil prices. Recovery above 79.50 is unlikely, but would warn of a primary up-trend — and weaker gold and oil prices.
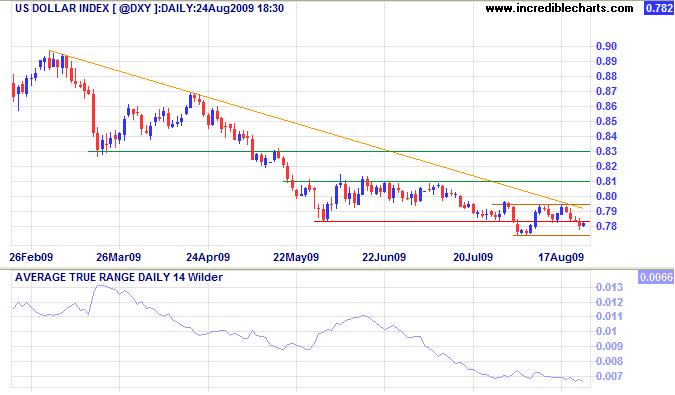
* Target calculation: 78.5 - ( 83 - 78.5 ) = 74
Gold
Spot gold is consolidating in a triangular pattern below resistance at $1000. Breakout below short-term support at $925 would test primary support at $900, while recovery above $970 would test $1000. In the long term, breakout above $1000 would signal an advance to $1100*, while failure of support at $900 would test the November low of $700.
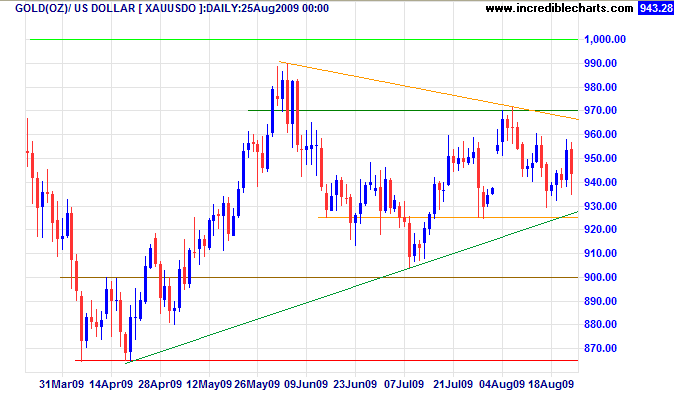
* Target calculation: 1000 + ( 1000 - 900 ) = 1100
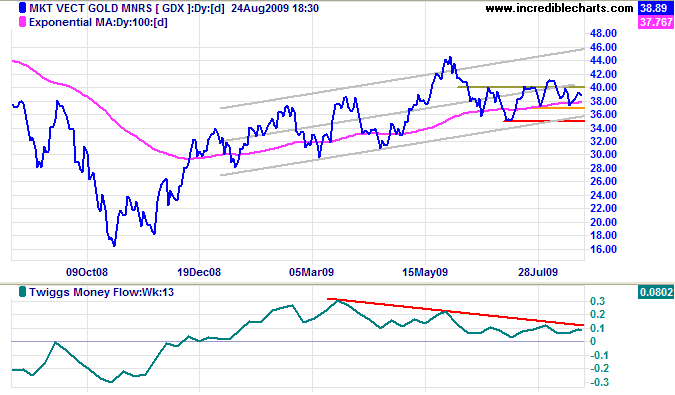
Declining Twiggs Money Flow (13-Week) warns of selling pressure on the Market Vectors Gold Miners Index [GDX]. Gold miners often act as an advance indicator of spot gold direction. Breakout below $35 is more likely and would warn that the primary trend is reversing, while recovery above $40 would signal an advance to the upper trend channel.
Silver
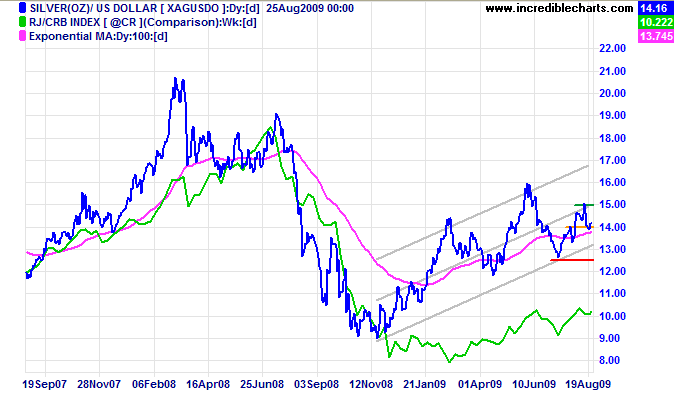
Spot silver is testing short-term support at $14. Recovery above $15 is likely and would signal an advance to the upper trend channel, while failure of support would test the lower trend channel. In the longer term, breakout below $12.50 would signal a primary trend reversal — and strong bear signal for gold.
Platinum
Platinum is more affected by industrial demand than gold or silver — and tracks the CRB Commodities Index fairly closely. With the upturn in manufacturing activity, the spot price is testing resistance at $1300/ounce. Upward breakout is likely and would signal an advance to $1500*. Reversal below $1100 is unlikely, but would signal a primary trend change.
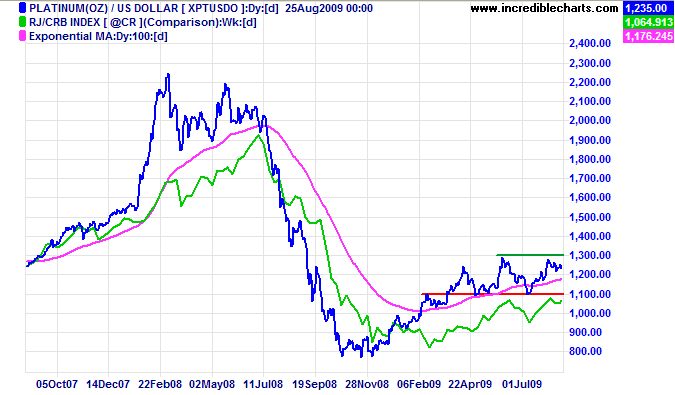
* Target calculation: 1300 + ( 1300 - 1100 ) = 1500
Crude Oil
Crude oil broke through resistance at $75 after respecting support at $70/barrel — offering a target of $80*. Reversal below $70 is unlikely, but would warn of a bull trap. Recovery of the CRB Commodities Index above its earlier high of 268 would strengthen the bull signal.
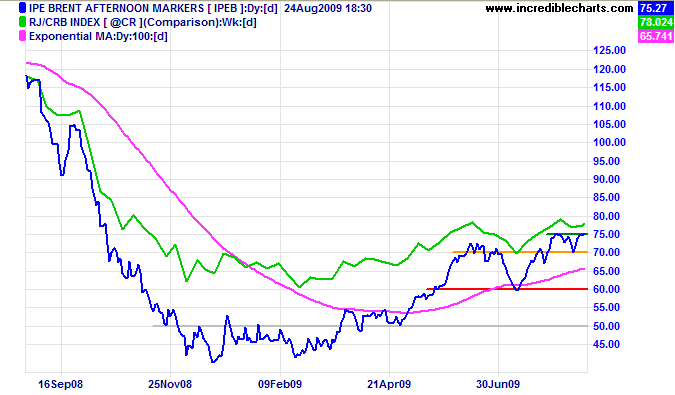
* Target calculation: 70 + ( 70 - 60 ) = 80
Help to keep this newsletter free! Forward this link to friends and colleagues
![]()
Even a purely moral act that has no hope of any immediate and visible political effect can gradually and indirectly, over time, gain in political significance.
~ Vaclav Havel
