Personal Income, Crude Oil & Durable Goods Orders
By Colin Twiggs
May 28, 2009 9:00 p.m. ET (11:00 a.m. AET)
These extracts from my trading diary are for educational purposes and should not be interpreted as investment or trading advice. Full terms and conditions can be found at Terms of Use.
Personal Income & Savings
Personal incomes are declining, as expected, along with GDP. Personal Income equals the combined height of the blue, yellow and pink bars on the chart below. Savings have climbed to almost 4 percent of personal income and are expected to climb a lot higher. The noticeable effect on personal outlays (expenditure) would be a lot worse if not for declining personal tax collections.
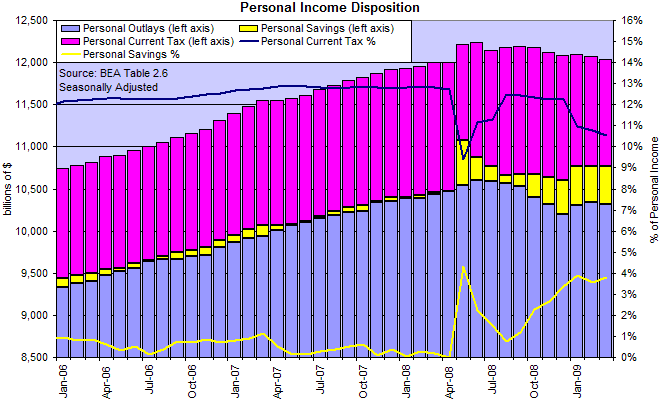
Tax collections have fallen from 13 percent of personal income in 2007 to 10.5 percent in 2009. This may offset the impact of rising savings on consumption, but it raises a far bigger problem. Unwilling to face the tough decisions needed to bring the economy back on an even keel, the new administration is sinking the ship with massive stimulus spending while tax revenues are falling. If the fiscal deficit spirals out of control, the only way to restore bouyancy is the "Mugabe option": hyper-inflation as the government prints new money to pay off its debts.
That is why gold is rising despite the present deflation caused by credit contraction. This is not just a US problem — it is a global problem. If the elephant in the lifeboat falls over, we all sink.
Crude Oil Production & Inventories
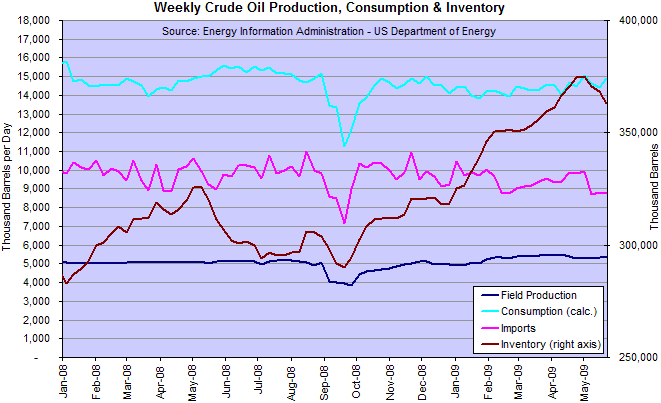
US crude oil inventories are falling — attributable to both declining imports and rising consumption. Consumption above 15 million barrels/day would be a sign that economic activity is recovering.
Durable Goods Orders
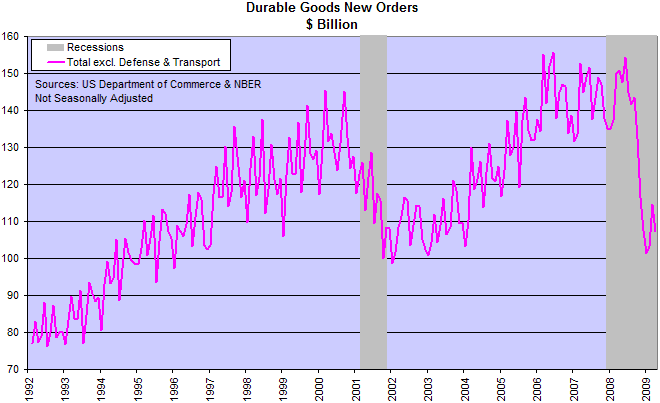
In the same way as a moving average can diverge from price data, seasonally adjusted data can diverge from actual. The most accurate way of tracking trend changes is by plotting non-seasonally adjusted (NSA) data over several years.
Durable goods orders reflect improving consumer confidence, with a relatively mild decline over the last few months. An up-turn (trough) above 100 would be a positive sign for the economy and the stock market, indicating that business activity is recovering. But that is not the whole story.
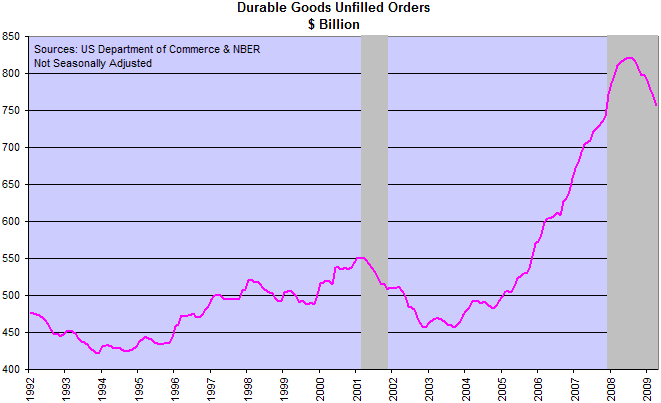
The decline in unfilled orders indicates that production is running faster than the rate of new orders — warning of further declines in production as the unfilled order book shrinks.
Capital Goods Orders
Orders for new capital goods are an outstanding lead indicator of new business investment — vital for the health of the economy and future growth. Business investment has a multiplier effect on the rest of the economy. It not only creates employment for those manufacturing capital equipment, but creates new jobs operating the equipment and in selling and distributing the ouput.
Unfortunately the signs are not good. The sharp drop in capital goods orders suggests that the down-trend will continue.
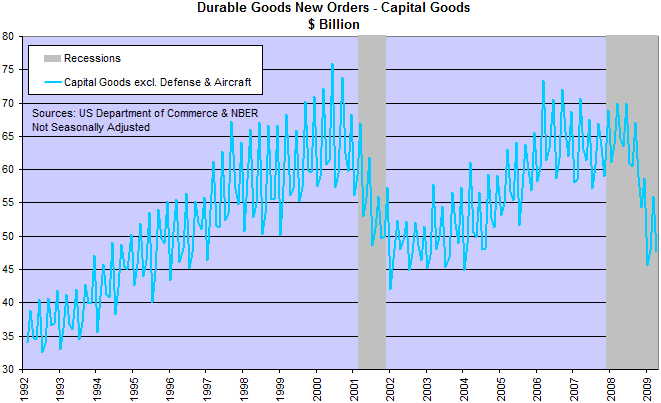
The markets may be showing some bouyancy, with rising stocks and commodity prices — and rising consumer confidence. But the fundamental building blocks of a recovery are missing. Traders need to remain alert to the potential for a sharp reversal, while investors, if still in the market, should be as defensive as possible.
All our progress is an unfolding, like a vegetable bud.
You have first an instinct, then an opinion, then a knowledge as the plant has root, bud, and fruit.
Trust the instinct to the end, though you can render no reason.
~
Ralph Waldo Emerson

Author: Colin Twiggs is a former investment banker with almost 40 years of experience in financial markets. He co-founded Incredible Charts and writes the popular Trading Diary and Patient Investor newsletters.
Using a top-down approach, Colin identifies key macro trends in the global economy before evaluating selected opportunities using a combination of fundamental and technical analysis.
Focusing on interest rates and financial market liquidity as primary drivers of the economic cycle, he warned of the 2008/2009 and 2020 bear markets well ahead of actual events.
He founded PVT Capital (AFSL No. 546090) in May 2023, which offers investment strategy and advice to wholesale clients.
