Bear Market Rally
By Colin Twiggs
February 2, 3:00 a.m. ET (7:00 p.m. AET)
These extracts from my trading diary are for educational purposes and should not be interpreted as investment advice. Full terms and conditions can be found at Terms of Use.
USA
We are witnessing a typical bear market rally and traders expecting a "false signal" or an early end to the bear market are likely to be disappointed.
Dow Jones Industrial Average
The Dow is undergoing a bear market rally which could carry as high as 12800/13000, where it is likely to encounter stiff resistance.
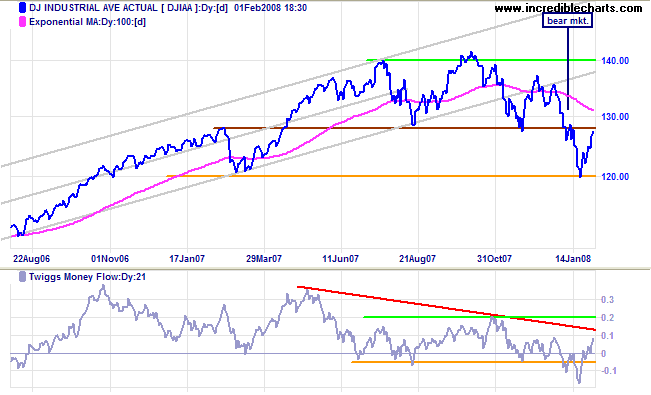
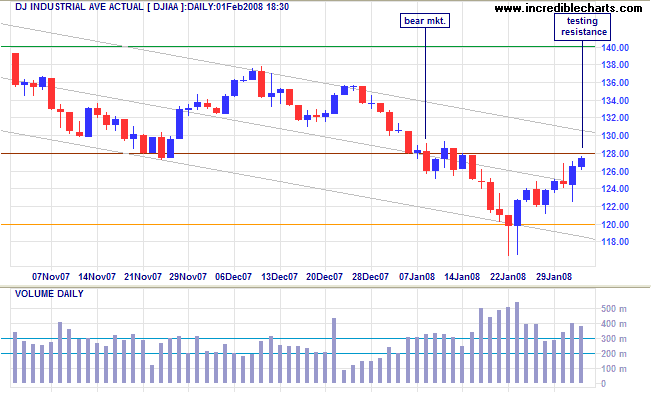
Short Term: Strong volume and a narrow range indicate increased resistance. Reversal below Thursday's low would warn that the rally has failed.
S&P 500
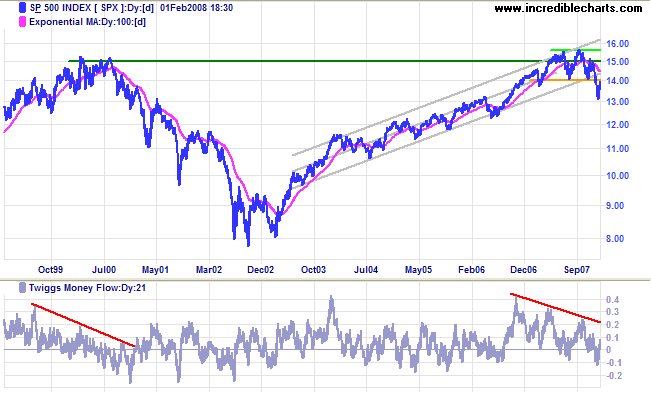
The S&P 500 is similarly testing resistance at 1400. The long term chart shows how bear market rallies tend to respect the long-term (100-day) moving average from below.
Small Caps
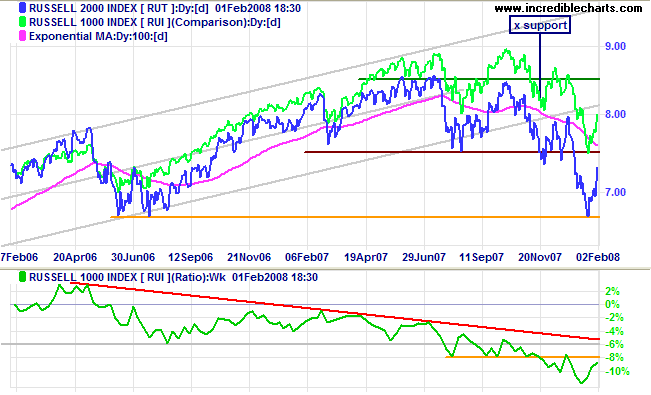
The Russell 2000 is likewise headed for a test of resistance at 750.
Technology
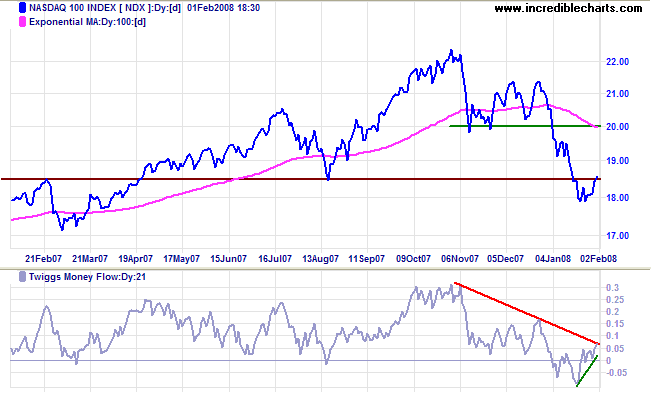
The Nasdaq 100 penetrated resistance at 1850 on positive earnings from Microsoft and a possible takeover of Yahoo. Twiggs Money Flow signals (short-term) accumulation and the rally could test resistance at 2000 or the long-term moving average.
Transport
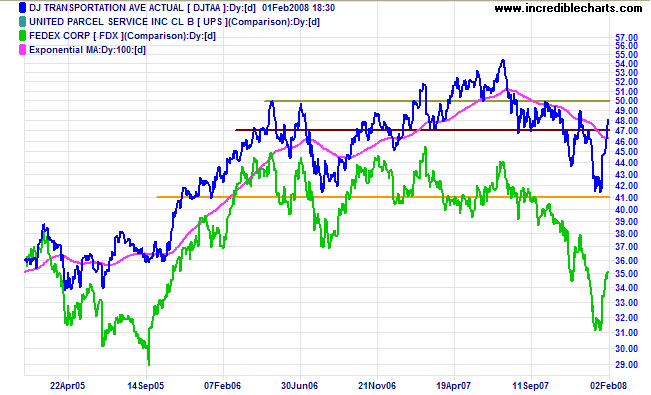
The Dow Jones Transportation Average rallied strongly, breaking resistance at 4700 and headed for a test of 5000. Fedex remains decidedly weak despite the latest rally.
United Kingdom: FTSE
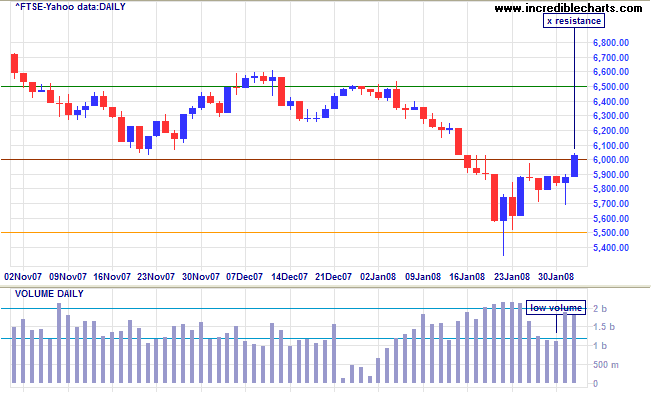
The FTSE 100 penetrated resistance at the former primary support level of 6000. Further gains on light volume would be a (medium-term) positive sign, while strong volume would signal continued selling by long-term stockholders. Reversal below 6000 would signal another test of 5500.
India: Sensex
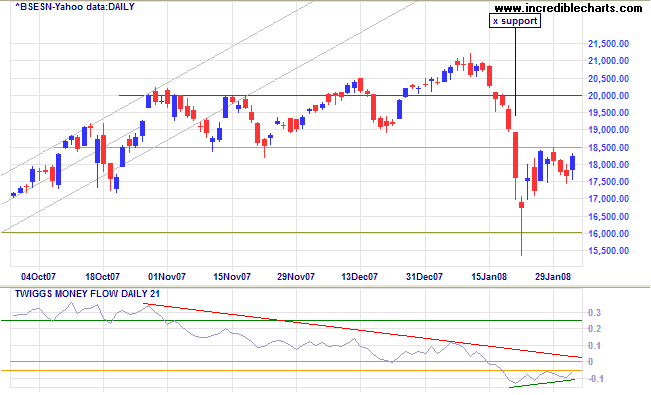
The Sensex is consolidating below resistance at 18500. Twiggs Money Flow signals (short-term) accumulation and a breakout above 18500 would indicate another test of 20000. Reversal below 17500 would warn of a test of 16000.
Japan: Nikkei
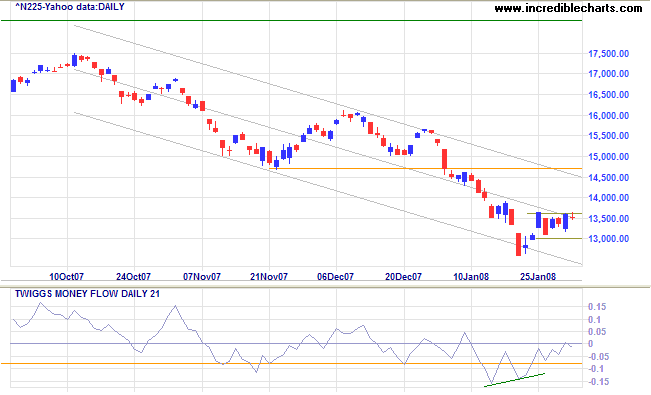
The Nikkei 225 is consolidating in a narrow rectangle above the lower trend channel. Reversal below 13000 would signal another test of the lower channel, while an upward breakout would test the upper channel or resistance at 14700. Twiggs Money Flow signals (short-term) accumulation, favoring an upward breakout.
China: Hang Seng & Shanghai
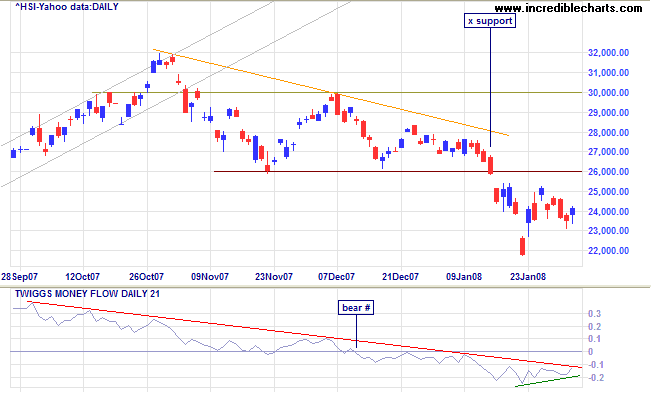
The Hang Seng also signals short-term accumulation (on Twiggs Money Flow) and is likely to test resistance at 26000.
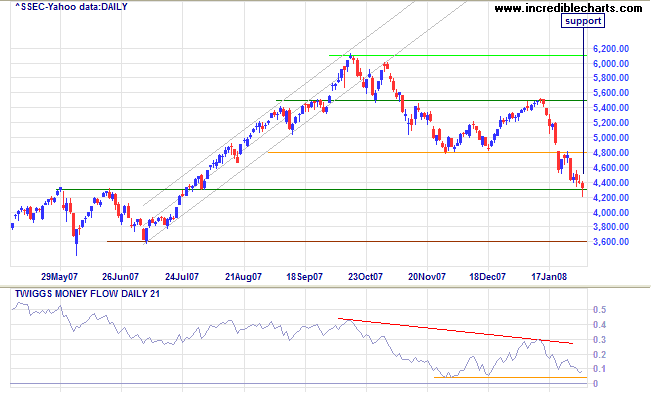
The Shanghai Composite should find support at 4300, though the only indication so far is a long tail on Friday's candle. Twiggs Money Flow fall below 0.04 would be a bear signal.
Australia: ASX
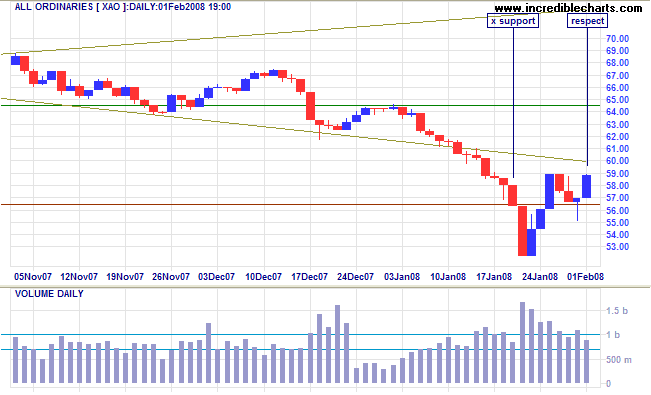
The All Ordinaries respected support at 5650, while Twiggs Money Flow signals short-term accumulation. Expect some resistance at 6000, but we could see a test of 6400. Further weakness on the Dow, however, would spoil the party.
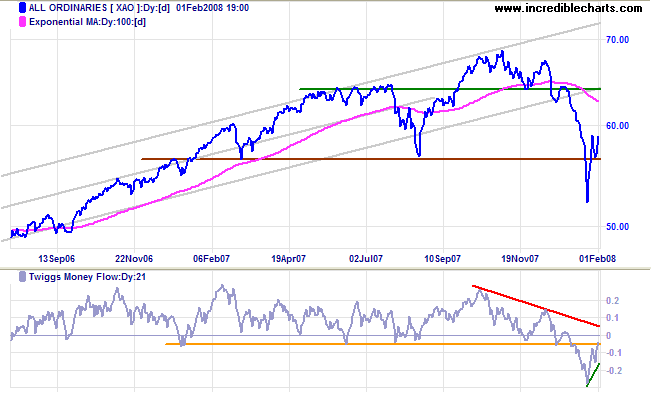
Short Term: Light volume on the rally would be a (medium-term) positive sign, while strong volume would signal continued selling by long-term stockholders. Reversal below 5650 would signal another test of 5000.
Always drink upstream from the herd.
~ Will Rogers
To understand my approach, please read Technical Analysis & Predictions in About The Trading Diary.
