Fedex Warning: Worse To Come
By Colin Twiggs
November 17, 2:00 a.m. ET (6:00 p.m. AET)
These extracts from my trading diary are for educational purposes and should not be interpreted as investment advice. Full terms and conditions can be found at Terms of Use.
USA
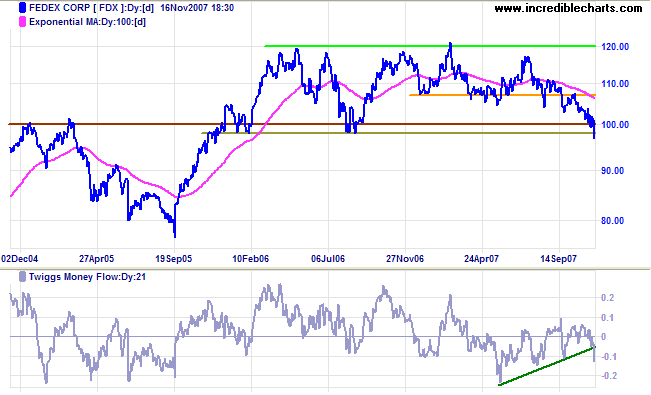
Fedex broke through long-term support at $100, warning of an economic slow-down. The largest component of the Dow Jones Transportation Avearge, this bellwether stock has been ranging between $100 and $120 for the last two years.
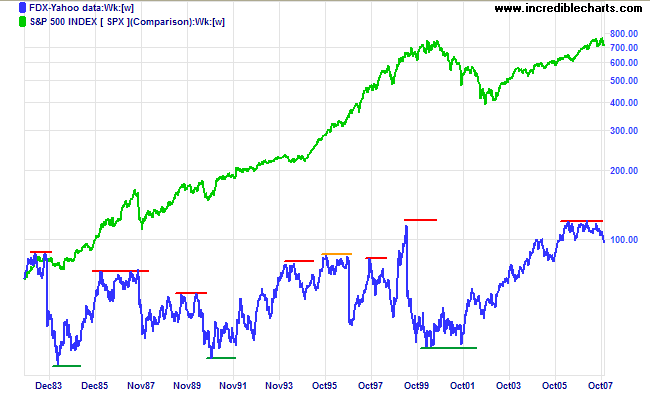
Divergences with the S&P 500 often precede a primary trend change or major (e.g. September 98) correction in the broader market.
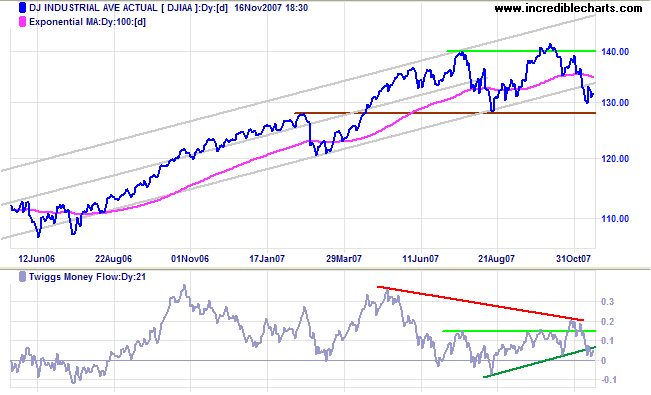
Dow Jones Industrial Average
The Dow Jones Industrial Average made a clear break below its long-term trend channel, indicating a loss of momentum. Failure of support at 12800 would signal a primary trend reversal. Twiggs Money Flow shows a long-term bearish divergence (red) and has reversed below the rising green trendline, warning of further distribution.
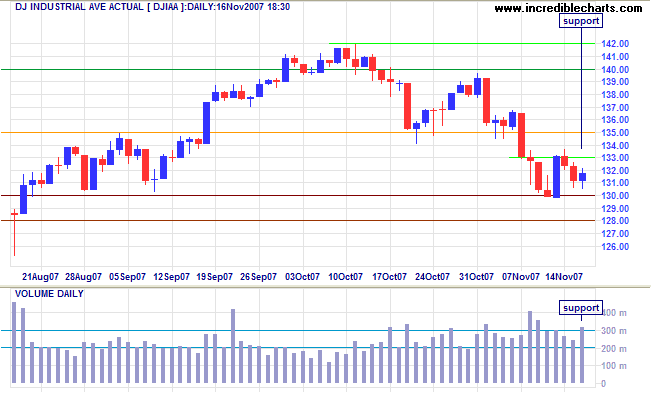
Short Term: Friday's blue candle and strong volume indicate buying support. Penetration of 13000 would warn of a test of primary support at 12800, while a close above 13300 would indicate that the correction is over.
Transport
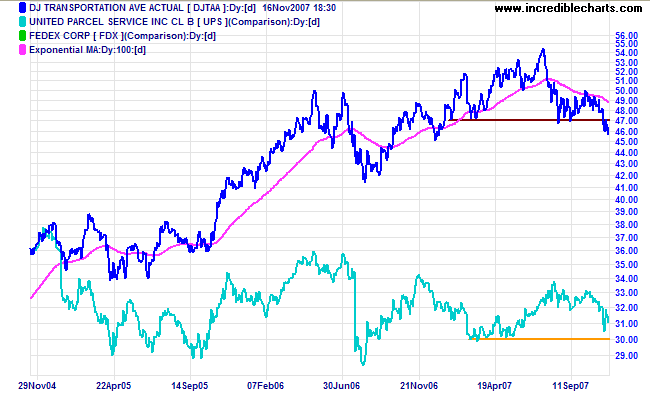
The Dow Jones Transportation Average continues in a primary down-trend after breaking support at 4700 — indicating that the economy is slowing. UPS has also been ranging for some time and is now headed for a test of primary support from its March 2007 low.
Small Caps & Technology
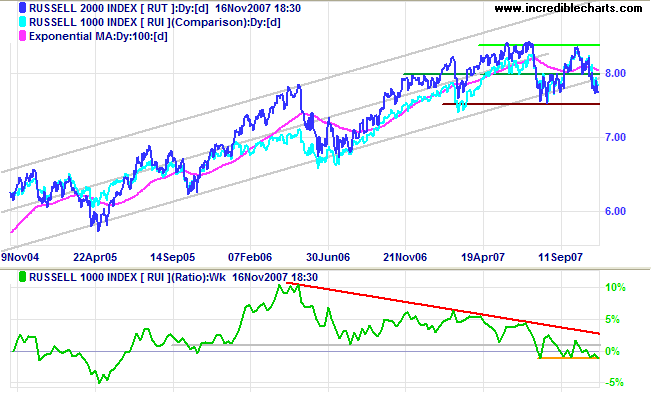
The Russell 2000 Small Caps index is headed for a test of primary support at 750. The declining price ratio (compared to Russell 1000) reflects the market preference for large cap stocks — to be expected in times of uncertainty.
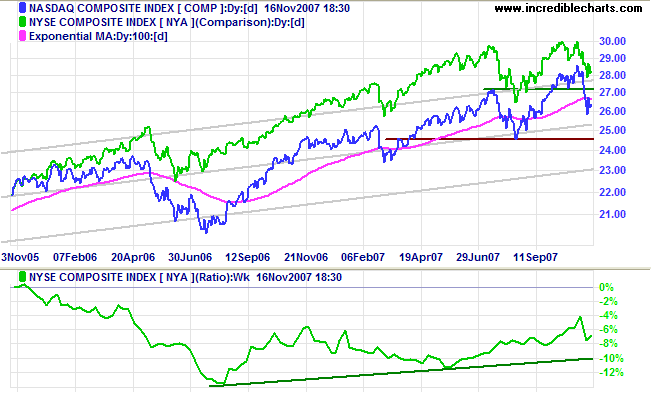
The Nasdaq Composite is undergoing a secondary correction after breaking 2700, with primary support at 2450. The rising price ratio (compared to NYSE Composite) shows how the market favored technology stocks over the past 12 months.
S&P 500
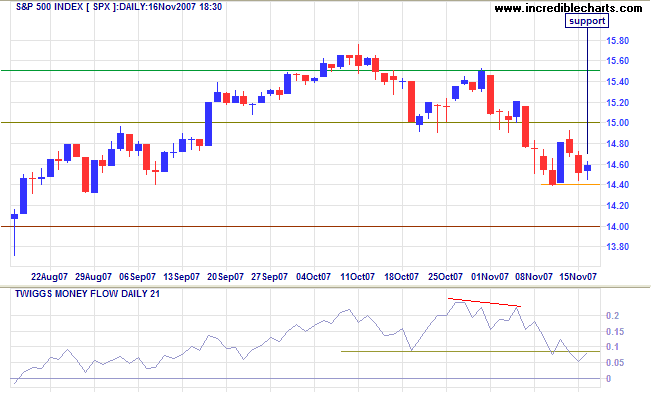
The S&P 500 found short-term support at 1440. Failure would mean a test of primary support at 1400; while a rise above 1500, while not yet expected, would indicate the secondary correction has ended.
United Kingdom: FTSE
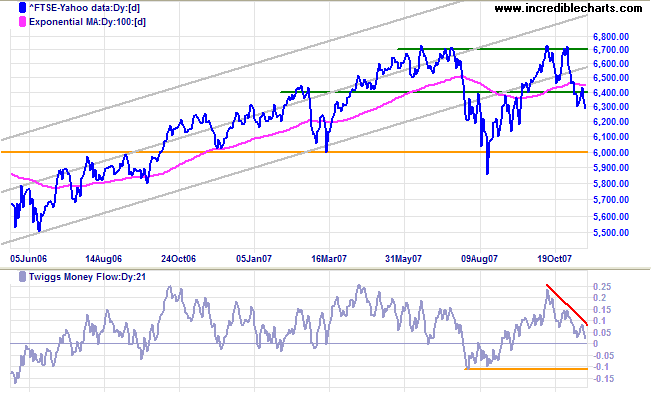
The FTSE 100 is also undergoing a secondary correction. Break of support at 6000 would signal a primary trend reversal, but at this stage respect of support appears equally likely. A Twiggs Money Flow fall below -0.1 would threaten primary support.
India: Sensex
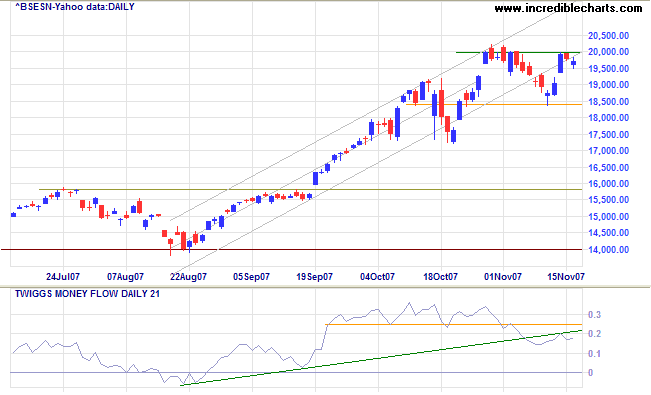
The Sensex is again testing resistance at 20000. Narrow consolidation would be a bullish sign, while breakout above 20000 would indicate another advance — with a target of 21500 [20000+(20000-18500)]. Reversal below 18500 is equally likely, however, and would signal a secondary correction. Twiggs Money Flow recovery above 0.25 would be a bullish sign, while a fall below zero would be a strong bear signal.
Japan: Nikkei
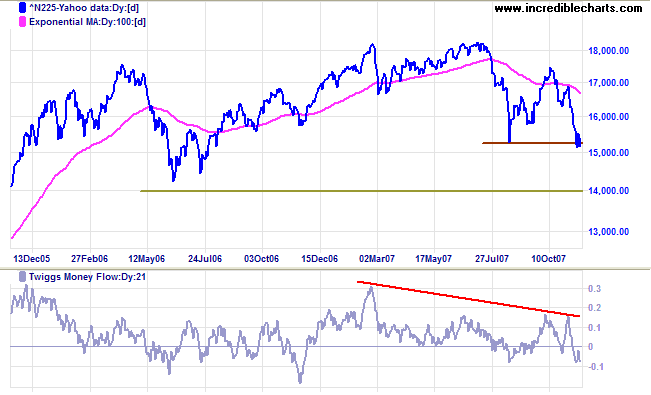
The Nikkei 225 broke below 15300, warning of another primary decline with a likely target of 14000. The longer that Twiggs Money Flow remains below zero, the stronger the distribution signal.
China: Hang Seng & Shanghai
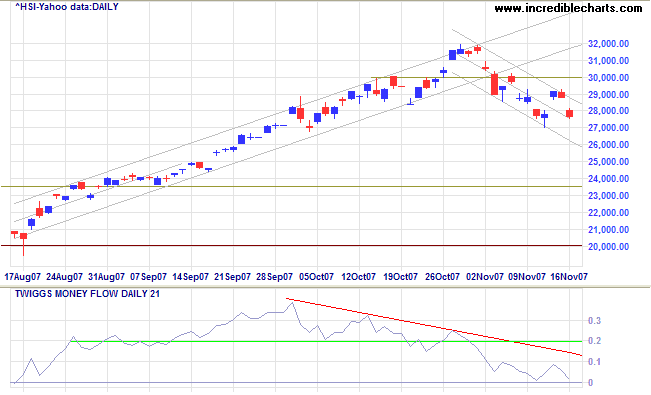
The Hang Seng is undergoing a secondary correction, with a clear downward trend channel. A Twiggs Money Flow break below zero (the low from the August 2007 correction) would be a strong bear signal. Primary support remains at 20000.
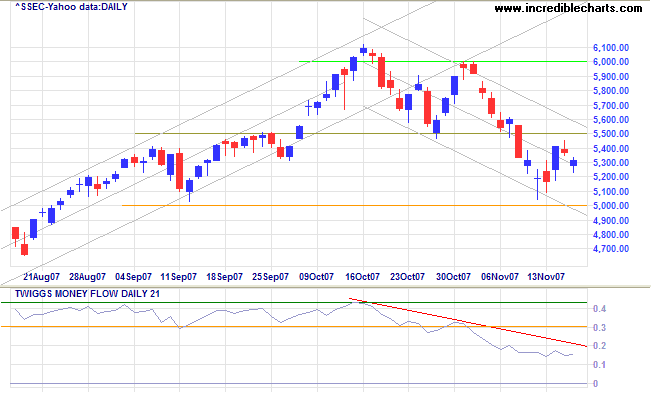
The Shanghai Composite is in a similar secondary correction, with Twiggs Money Flow signaling distribution. Penetration of support at 5000 would warn of another down-swing, while recovery above 5500 would be a bullish sign. The market is in the final phase (stage 3) of a bull market and primary support is a long way below at 3600; so the index may be prone to a sharp fall.
Australia: ASX
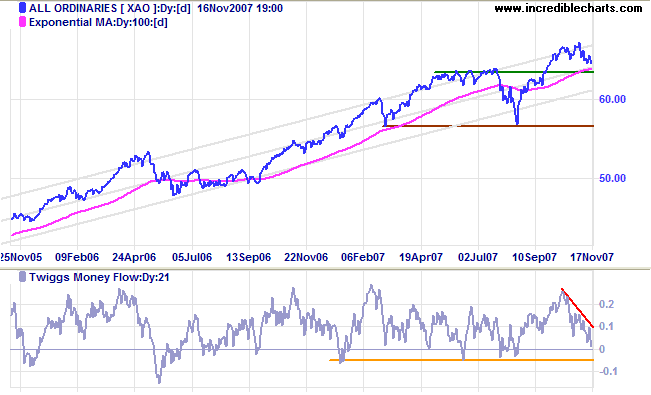
The All Ordinaries is edging downwards, headed for a test of the lower trend channel; though it still has to overcome support at 6450 (from the July 2007 high). Failure of the lower trend channel would warn of a test of primary support at 5650, while respect of 6450 would be a bullish sign. A Twiggs Money Flow break below -0.05 would warn that primary support is threatened.
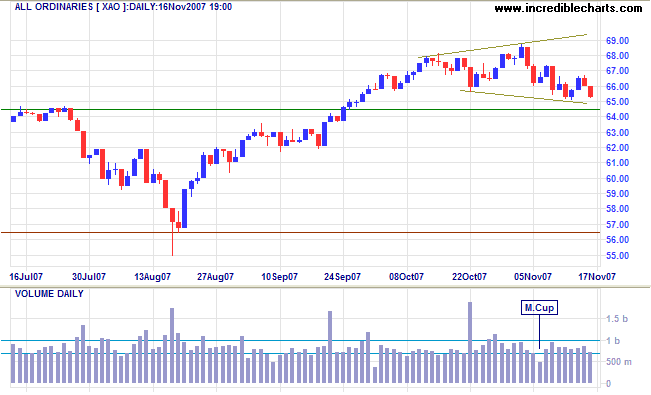
Short Term: The broadening top is not yet fully formed: two peaks and two troughs are required and the second trough remains unclear. Broadening top patterns are very reliable, with only a 4% failure rate (for downside breakouts) according to Thomas Bulkowski's Encyclopedia of Chart Patterns. Failed up- or down-swings (partial rises or declines) often provide early indication of the breakout direction.
We may learn wisdom by three methods: first, by reflection,
which is noblest; second, by imitation, which is easiest; and
third by experience, which is the most bitter.
~ The Analects of Confucius.
To understand my approach, please read Technical Analysis & Predictions in About The Trading Diary.

Author: Colin Twiggs is a former investment banker with almost 40 years of experience in financial markets. He co-founded Incredible Charts and writes the popular Trading Diary and Patient Investor newsletters.
Using a top-down approach, Colin identifies key macro trends in the global economy before evaluating selected opportunities using a combination of fundamental and technical analysis.
Focusing on interest rates and financial market liquidity as primary drivers of the economic cycle, he warned of the 2008/2009 and 2020 bear markets well ahead of actual events.
He founded PVT Capital (AFSL No. 546090) in May 2023, which offers investment strategy and advice to wholesale clients.
