Markets Undergo A Secondary Correction
By Colin Twiggs
August 4, 2007 1:30 a.m. EST (3:30 p.m. AEST)
These extracts from my trading diary are for educational purposes and should not be interpreted as investment advice. Full terms and conditions can be found at Terms of Use.
USA: Dow, Nasdaq and S&P500
The subprime mortgage crisis has reminded lenders and investors
of the dangers of under-pricing risk. Equity markets seem to be
anticipating a lower rate of credit expansion - and lower
earnings growth - in the year ahead.
The Dow Jones Industrial Average fell through support
from the consolidation of recent months, warning of a secondary
correction.
Twiggs Money Flow below zero signals distribution.
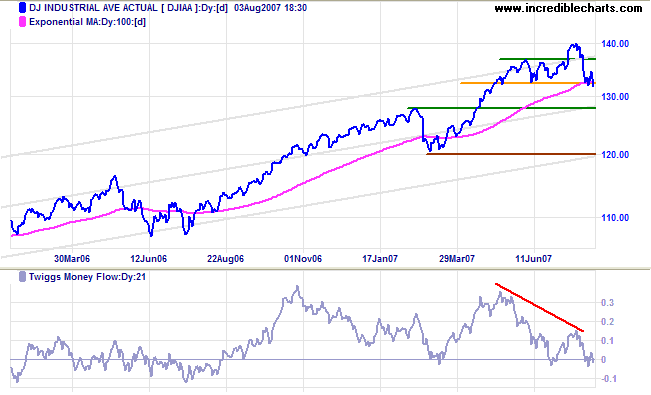
Long Term: The primary trend remains up, with support at 12800 and 12000.
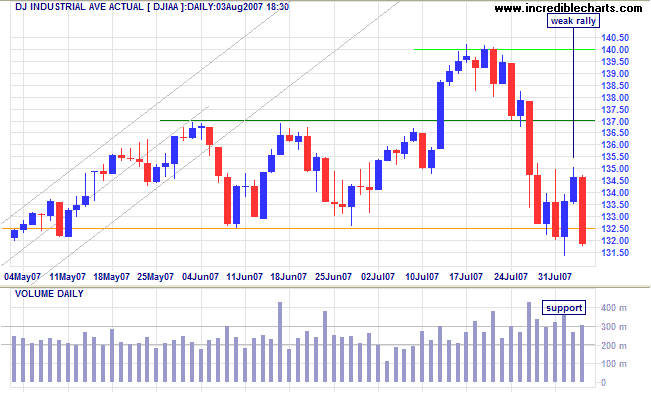
Short Term: Wednesday's blue candle and strong volume indicated support, but the rally soon faded. Friday's close below 13200 warns of a down-swing to test 12800.
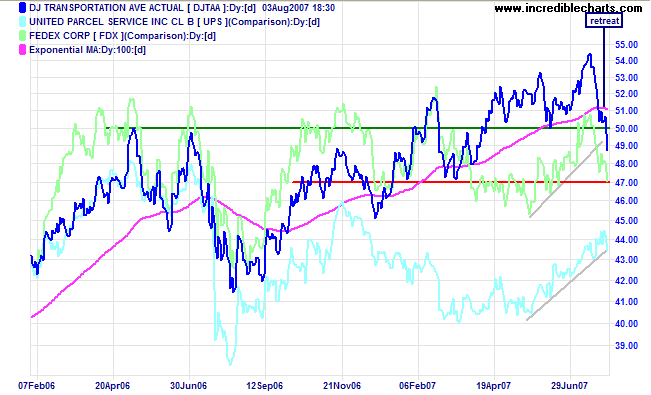
The Dow Jones Transportation Average retreated below 5000, the base of the past few months accumulation. The secondary correction is likely to test primary support at 4700. Fedex is retreating to test primary support while UPS is holding above its rising trendline. Reversal of these two stocks below their 2007 lows, though not yet expected, would be a strong bear signal.
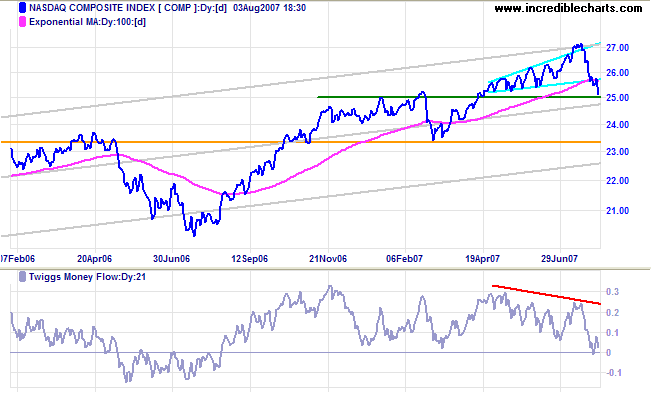
The Nasdaq Composite is undergoing a secondary
correction after breaking out of the recent ascending
broadening wedge pattern. Penetration of support at 2500 would
warn of a test of primary support at 2340.
Long Term: The primary trend remains up.
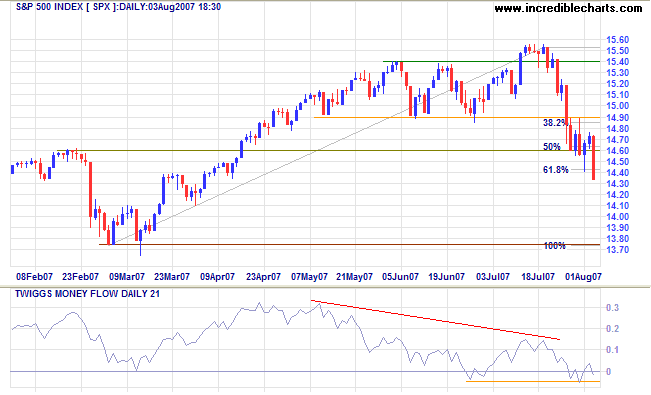
The S&P 500 closed sharply lower, below Wednesday's
low and the 61.8% Fibonacci level. Expect a test of primary
support at 1375. A Twiggs Money Flow fall below Wednesday's low
would signal further distribution.
Long Term: The primary trend remains up.
LSE: United Kingdom
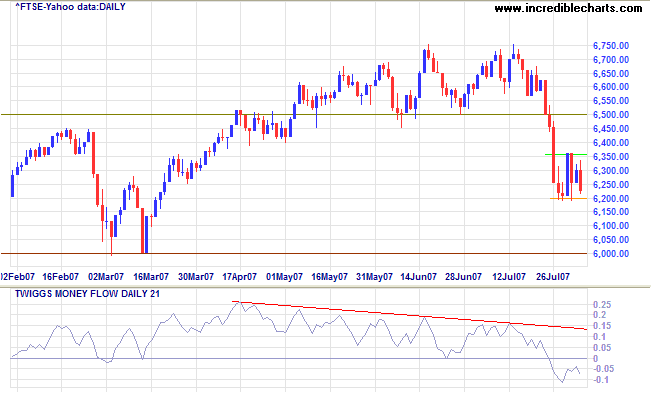
The FTSE 100 is consolidating between 6200 and 6350. A
downward breakout is likely and would signal a test of primary
support at 6000. Twiggs Money Flow signals strong
distribution.
Long Term: The primary trend remains up, however.
Japan: Nikkei
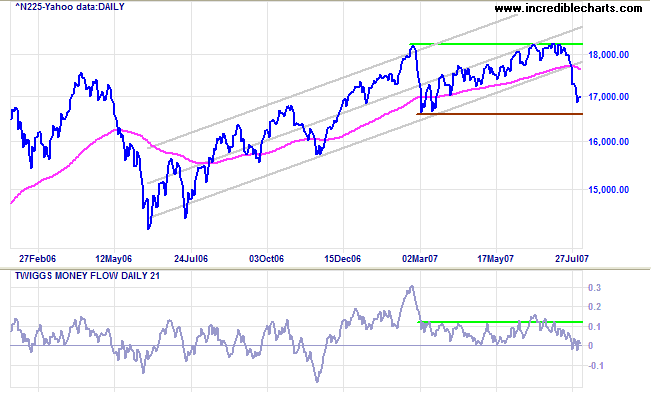
The Nikkei 225 is headed for a test of primary support
at 16600.
Twiggs Money Flow whipsawing around zero indicates
uncertainty.
Long Term: The primary up-trend continues.
China: Hang Seng & Shanghai
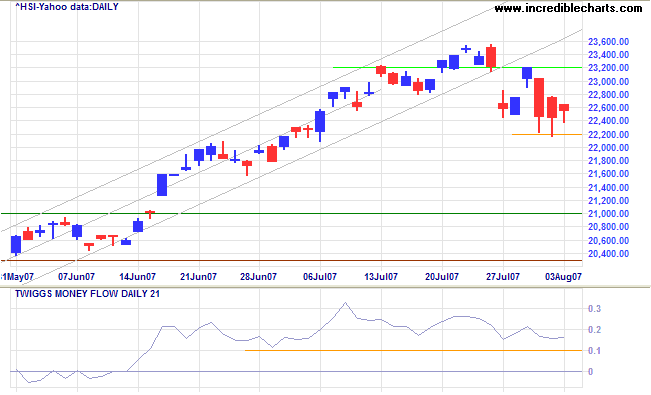
The Hang Seng is consolidating between 22200 and 23200. Long tails on the last 3 candles reflect significant support. Future direction will be indicated by an upward/downward breakout. A Twiggs Money Flow fall below 0.1 would signal that a test of support at 21000 is more likely.
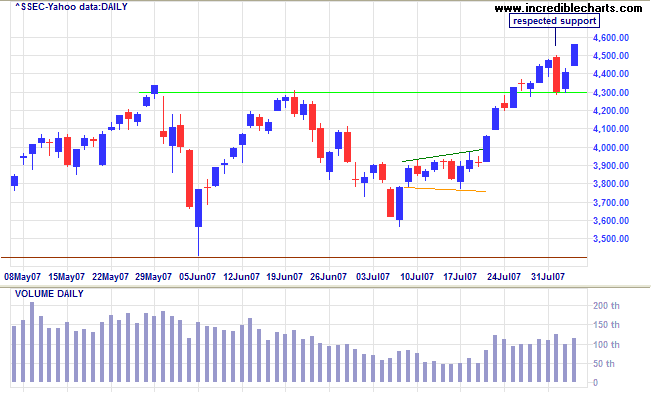
The Shanghai Composite index stands out from the crowd, reflecting strong bullish sentiment. After respecting support at 4300, despite negative news from Western markets, the index rallied to above 4500. The target remains at 5000 (4300+[4300-3600]), although we may see further short retracements before then.
ASX: Australia
The All Ordinaries is undergoing a secondary correction,
testing support at 6000.
Twiggs Money Flow (21-day) whipsawing around zero indicates
uncertainty.
Long Term: The primary trend remains up, however, with
support at 5650.
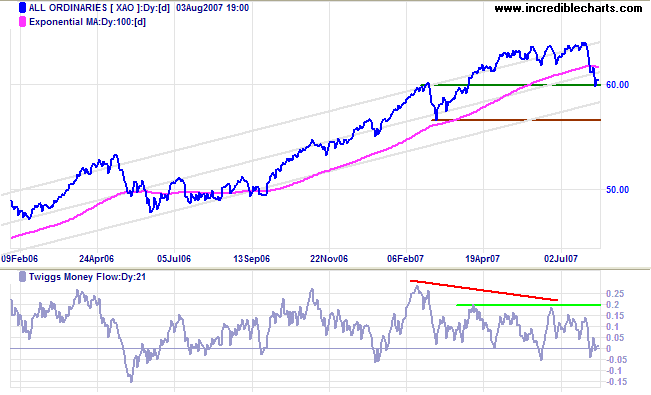
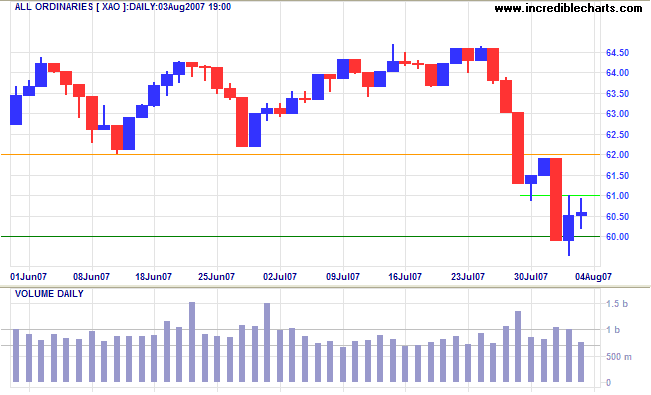
Short Term: Friday's doji with low volume signals indecision. Breakout below 6000 would warn of a test of the lower trend channel (on the long term chart) and possibly primary support at 5650. Further consolidation on low volume (a "dull market" as per today's quote) would be a positive sign, while reversal above 6100 would be premature and prone to failure.
One of Wall Street's oldest maxims was "Never sell a dull
market." Rallies in a bear market are sharp , but experienced
traders wisely put out their shorts again when the market
becomes dull after a recovery. Exactly the converse is true in
a bull market, where traders buy stocks if the market becomes
dull following a reaction.
~ William Peter Hamilton, December 30th 1921.
To understand my approach, please read Technical Analysis & Predictions in About The Trading Diary.

Author: Colin Twiggs is a former investment banker with almost 40 years of experience in financial markets. He co-founded Incredible Charts and writes the popular Trading Diary and Patient Investor newsletters.
Using a top-down approach, Colin identifies key macro trends in the global economy before evaluating selected opportunities using a combination of fundamental and technical analysis.
Focusing on interest rates and financial market liquidity as primary drivers of the economic cycle, he warned of the 2008/2009 and 2020 bear markets well ahead of actual events.
He founded PVT Capital (AFSL No. 546090) in May 2023, which offers investment strategy and advice to wholesale clients.
