Gold, Oil, Currencies & Interest Rates
By Colin Twiggs
May 8, 2007 4:15 a.m. EST (6:15 p.m. AEST)
These extracts from my trading diary are for educational purposes and should not be interpreted as investment advice. Full terms and conditions can be found at Terms of Use.
Gold
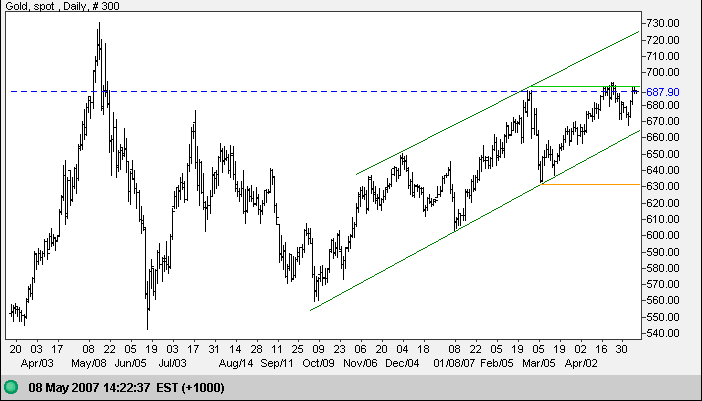
Spot gold is testing resistance at the earlier high of $690;
narrow consolidation below this level would be a bullish sign.
In the longer term, the metal continues in an up-trend bounded
by the (dark green) trend channel. Breakout above resistance
would signal a test of the upper border. A break below the
lower border would warn that the trend is slowing; and a fall
below support at $630, though unlikely, would signal that the
trend has reversed.
Weaker crude prices ease demand for gold.
Source: Netdania
Crude Oil
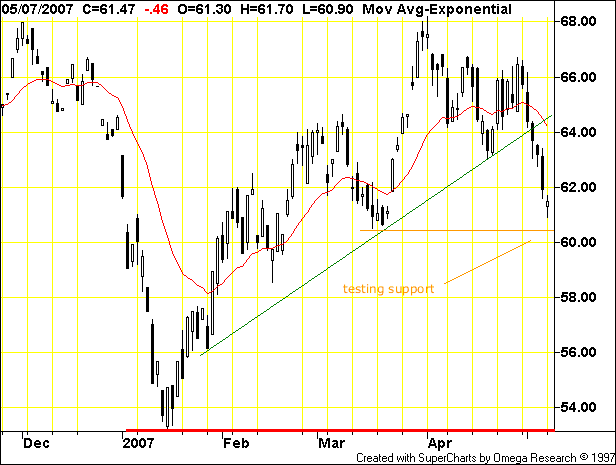
June Light Crude made a false break above the large flag in March/April before reversing sharply downwards. Failed patterns are often the most reliable signals and traders need to maintain a flexible mind-set in order to take advantage of them. A fall below support above $60 would signal another test of primary support at $53. V-bottoms often end up as W-bottoms, with an initial sharp rally fading into a second test of primary support.
Currencies
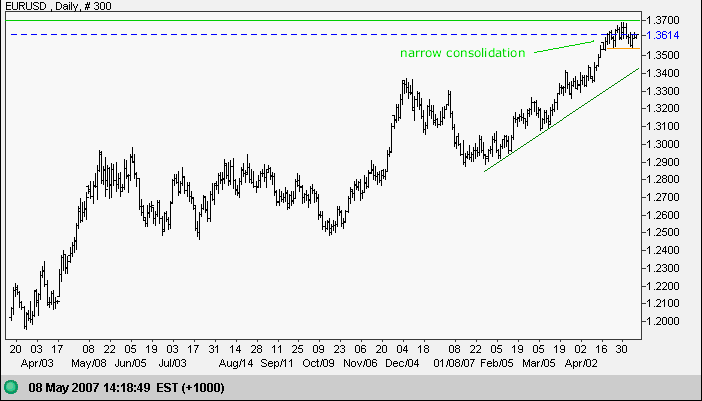
The euro continues a bullish narrow consolidation below resistance at the 2005 high of $1.37. Breakout above this level would be a strong sign for the euro, with a long-term target of $1.57 (1.37 + [ 1.37 - 1.17 ]). Reversal below $1.29, though unlikely, would signal that the up-trend has reversed.
Source: Netdania
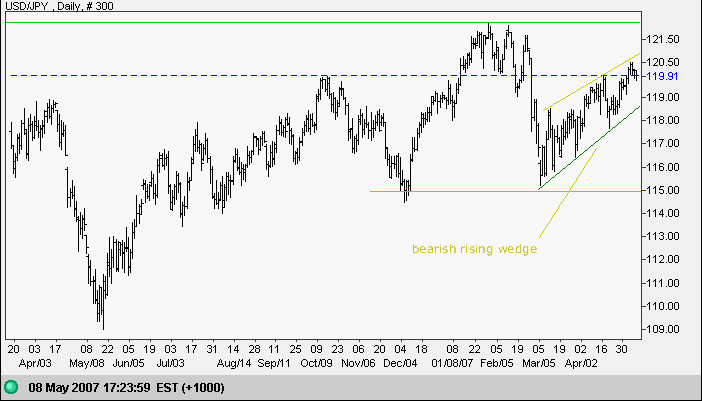
The dollar is forming a bearish rising wedge against the yen. Reversal below the (green) upward trendline would warn of a rest of support at 115.00, while breakout above the upper border, though not as likely, would signal a test of long-term resistance at 122. In the long-term, failure of support at 115 would warn of a major correction; while breakout above 122 would complete a bullish ascending triangle pattern on the weekly chart, with a calculated target of 134 (122 + [122-110]).
Source: Netdania
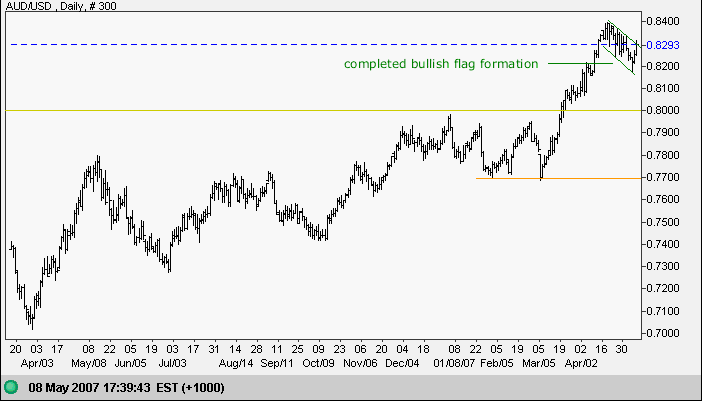
The Australian dollar completed a bullish short-term flag formation with a breakout above the upper border. The target is 0.87 ( 0.83 + [0.84-0.80]). A false break is not expected, but would warn of a test of the new support level at 80.
Source: Netdania
Treasury Yields
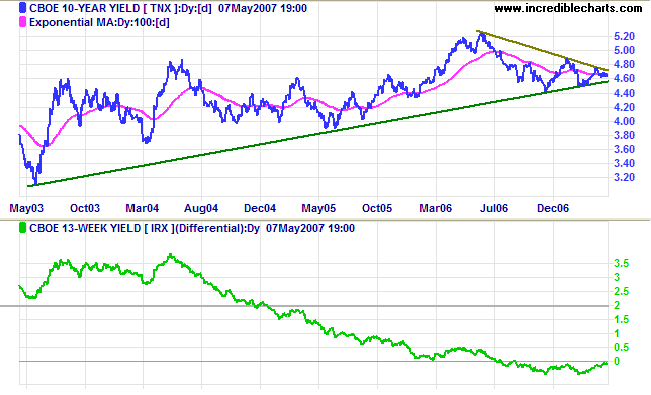
Ten-year treasury yields are consolidating in a narrowing symmetrical triangle above the long-term (green) trendline. We are in the last third of the pattern so reliability of any breakout signal is reduced. The yield differential (10-year minus 13-week treasury yields) remains negative, but is caused by low long-term yields rather than a sharp rise in short-term rates, reducing its significance.
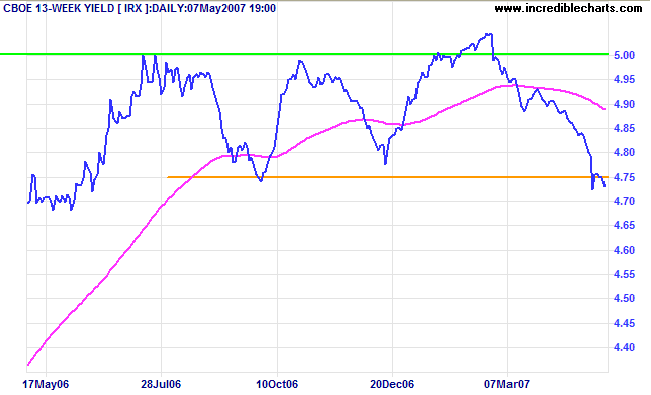
Short-term treasury yields have fallen below the lower border of the band maintained by the Fed for the last year. A continued fall below 4.75% would warn that something is amiss and the Fed is increasing liquidity in the economy.
Dow Jones Industrial Average
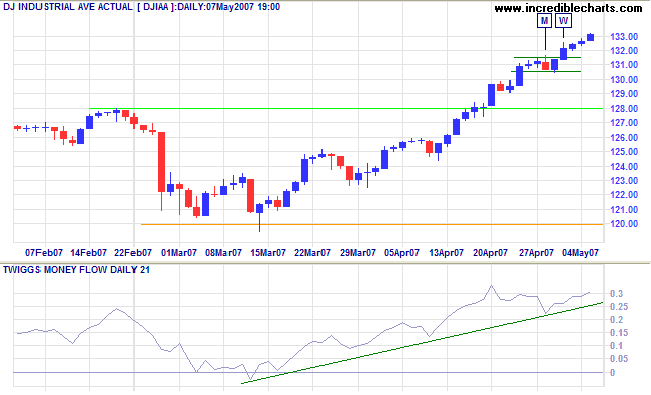
The Dow Jones Industrial Average continues to make new highs, while Twiggs Money Flow is trending upwards, signaling accumulation.
Wright Model
Probability of recession in the next four quarters remains at 45 per cent according to the Wright Model.
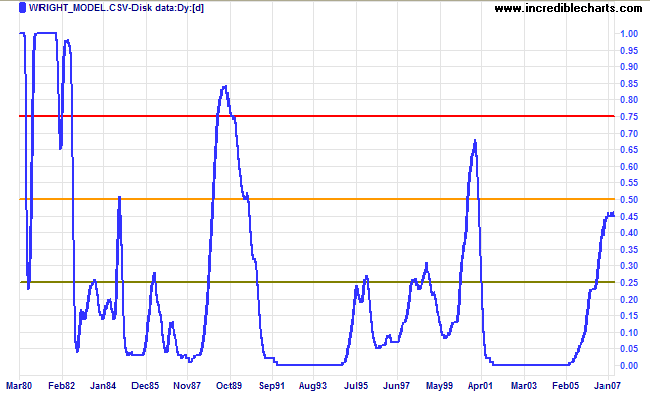
There is some evidence that the Wright model may understate probability of recession in a low interest rate environment (as at present).
One cannot wage war under present conditions without the
support of public opinion, which is tremendously molded by the
press and other forms of propaganda.
~ General Douglas MacArthur
To understand my approach, please read Technical Analysis & Predictions in About The Trading Diary.
