Markets Bullish After Crude Falls
By Colin Twiggs
August 17, 2006 21:30 p.m. ET
August 17, 2006 21:30 p.m. ET
These extracts from my daily trading diary are for educational
purposes and should not be interpreted as investment advice.
Full terms and conditions can be found at
Terms of Use.
The Big Picture
Equity markets look distinctly bullish after mild inflation
figures raised the prospect of an extended pause in interest
rates. The Nasdaq 100 has reversed above its
resistance level while the Dow Transport
Index is also testing resistance at its former breakout
level.
The Fed appears to have called the pause in interest rates correctly, with latest data signaling a slow-down in manufacturing and an easing of inflationary pressure. A fall in crude oil prices has also helped. The yield differential remains cause for concern: it has fallen well below zero and may cause problems in the months ahead.
Gold is weakening, accompanying the fall in crude oil, but the dollar has yet to show any real gains. This may be a prospect in the weeks ahead.
USA
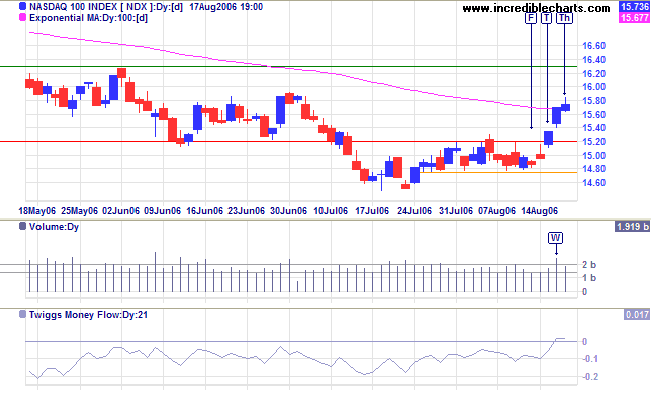
The Nasdaq 100 reversed above resistance at 1520 after
several weeks consolidation, signaling the start of an
intermediate up-trend. Note the strong volume on Wednesday [W]
when buyers overcame resistance.
Twiggs Money Flow (21-day) crossed to above zero for the
first time in more than 3 months.
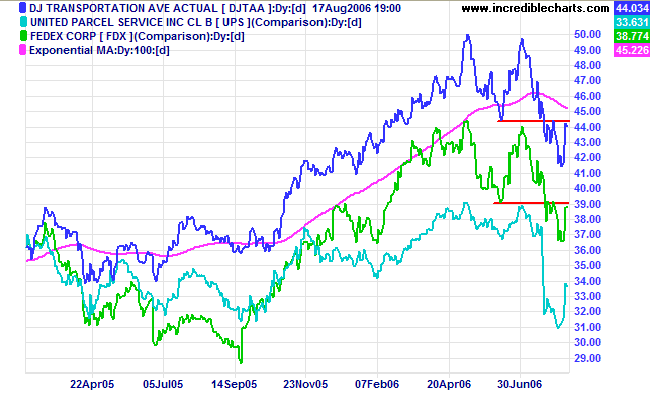
The Dow Jones Transportation Average has again pulled
back to test resistance at 4450, with lead indicator Fedex
following suit. Considering recent signals on the Dow and
S&P 500, watch for an upward breakout.
The Dow Industrial Average broke through resistance at
11250/11300 after a short pull-back.
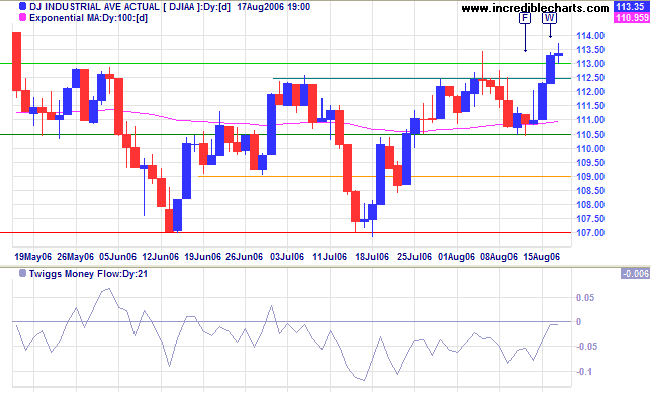
Medium Term: The target for the breakout is close to the
recent high of 11650: 11250 + (11250 - 10700) = 11700.
Twiggs Money Flow (21-day) shows early signs of
accumulation but remains below zero.
Long Term: The Dow continues in a primary up-trend, with support at 10700.
Long Term: The Dow continues in a primary up-trend, with support at 10700.
The S&P 500 broke through resistance at 1280 after a
short pull-back, completing an
ascending triangle. The target for the breakout is close to
the recent high of 1330: 1280 + (1280 - 1220) = 1340.
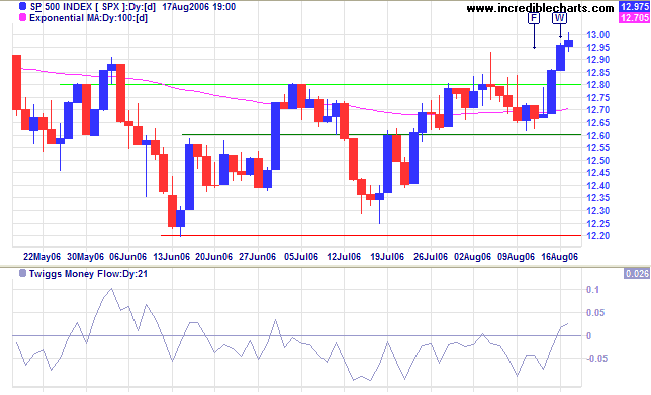
Medium Term:
Twiggs Money Flow (21-day) rose to above zero for the first
time in over a month.
Long Term: The S&P 500 is in a slow up-trend, with primary support at 1220.
Long Term: The S&P 500 is in a slow up-trend, with primary support at 1220.
Treasury yields
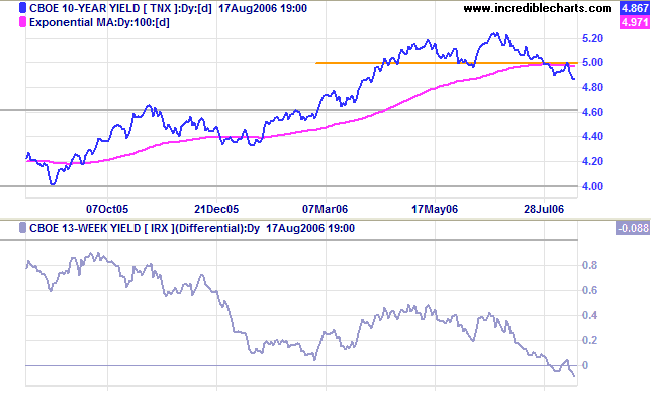
The yield on 10-year Treasury notes respected resistance at 5.0% and is now trending downwards.
Medium Term: Mild recent inflation figures have eased upward pressure on yields.
Long Term: The yield differential (10-year T-notes minus 13-week T-bills) fell sharply, making the economy extremely vulnerable.
The probability of recession in the next four quarters has
risen to 30 per cent, according to the Wright
Model developed by Fed economist Jonathan H Wright. While
not yet cause for concern, the model incorporates a fair amount
of lag, through the use of 3-month averages, and we can
anticipate further increases in the next few months.
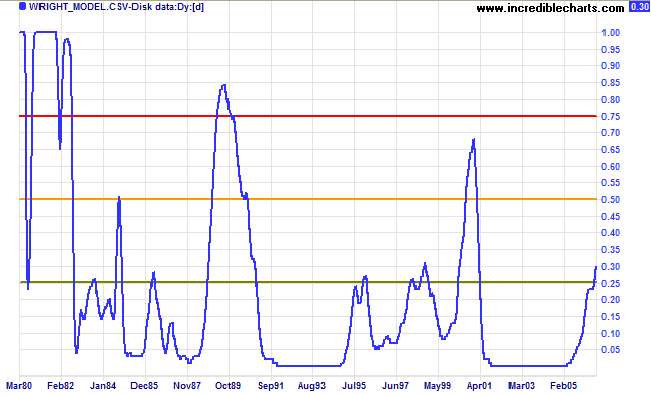
Colors on the Wright chart should be interpreted as follows:
- probability rises above 25%: while not yet cause for concern, watch the indicator regularly for signs of further deterioration;
- above 50%: the situation is becoming volatile -- so exercise caution;
- above 75% means dire risk of an economic downturn.
Gold
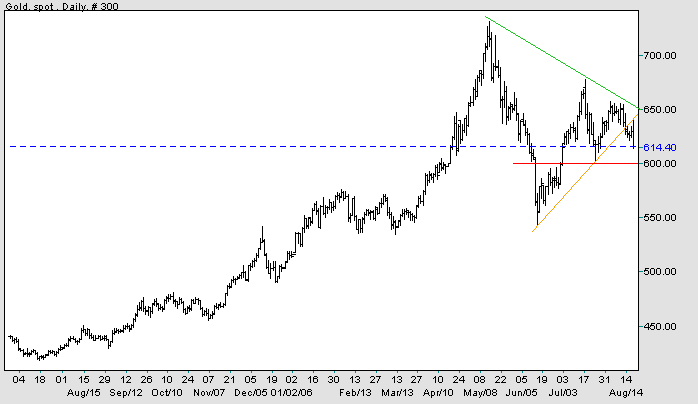
Spot gold is likely to weaken if crude oil establishes a primary down-trend.
Medium Term: The metal has broken out below a large symmetrical triangle. Penetration of support at $600 would signal another down-trend. The target for the triangle breakout is $450: (630 - (730 - 550)).
Long Term: The primary up-trend appears uncertain. Primary support is at $540/$550.
Source: Netdania
Crude Oil
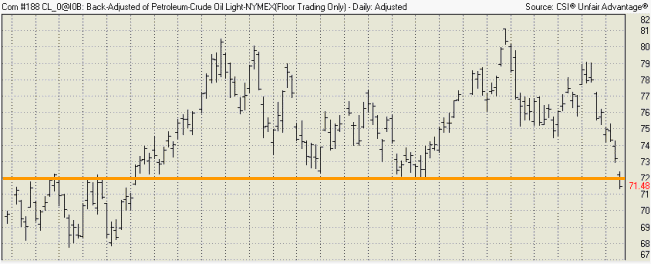
Light Crude has fallen through primary support at $72.00, signaling the start of a primary down-trend. A pull-back that respects the new resistance level would confirm the down-trend.
Light Crude has fallen through primary support at $72.00, signaling the start of a primary down-trend. A pull-back that respects the new resistance level would confirm the down-trend.
Currencies
Mild inflation figures and falling crude and gold prices should boost the dollar, but this is not yet evident on the charts.
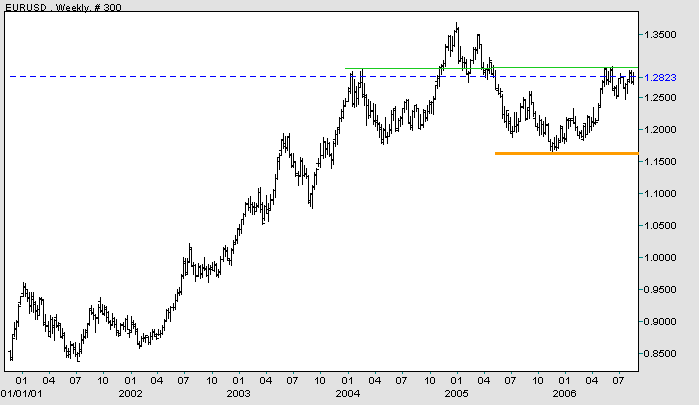
The Euro is consolidating below resistance at 1.30 dollars. A rise above this level would mean a test of the high at 1.35/1.36 (and a bullish sign for gold).
Mild inflation figures and falling crude and gold prices should boost the dollar, but this is not yet evident on the charts.
The Euro is consolidating below resistance at 1.30 dollars. A rise above this level would mean a test of the high at 1.35/1.36 (and a bullish sign for gold).
Source: Netdania
United Kingdom
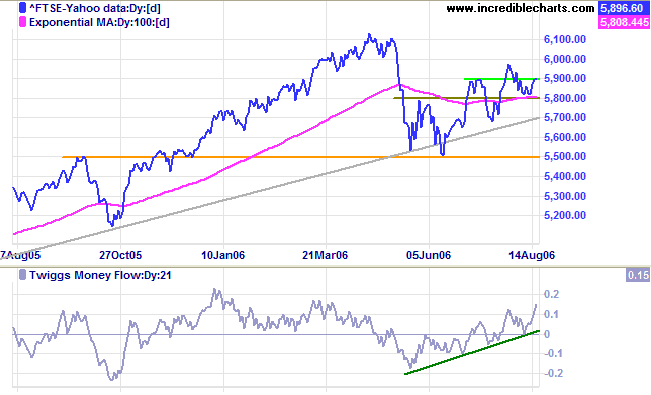
The FTSE 100 is trending slowly upwards. Having respected initial support at 5800 (from the first peak), and overcome resistance at 5900, we should see a rally test 6130.
Medium Term: A rise above 6000 would add further confirmation, while reversal below 5800 would signal another test of primary support at 5500. Twiggs Money Flow (21-day) is trending upwards, signaling accumulation.
Long Term: The index is in a primary up-trend.
Japan
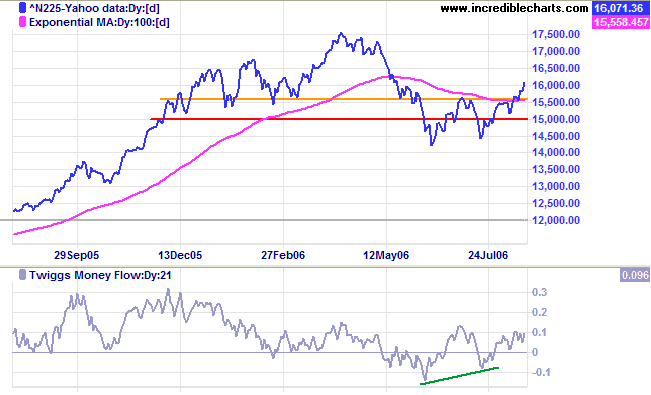
The Nikkei 225 broke out from a bullish ascending triangle.
Medium Term: We may see a pull-back to test the new support level at 15700. The target for the breakout is close to the previous high of 17500: (15700 + (15700 -14200)) = 17200. Twiggs Money Flow (21-day) is rising, signaling accumulation.
Long Term: The index has reversed to a primary up-trend.
ASX Australia
The All Ordinaries broke through the top of the recent consolidation at 5000. This is a bullish sign and we can expect a test of 5100 shortly. A breakout above 5100 would confirm that the intermediate up-trend has resumed.
The All Ordinaries broke through the top of the recent consolidation at 5000. This is a bullish sign and we can expect a test of 5100 shortly. A breakout above 5100 would confirm that the intermediate up-trend has resumed.
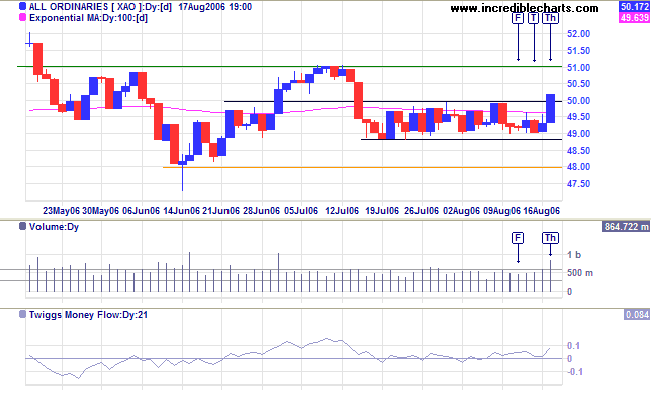
Medium Term: A rise above 5100 would indicate that a
test of 5300 is likely.
Twiggs Money Flow (21-day) is rising, signaling
accumulation.
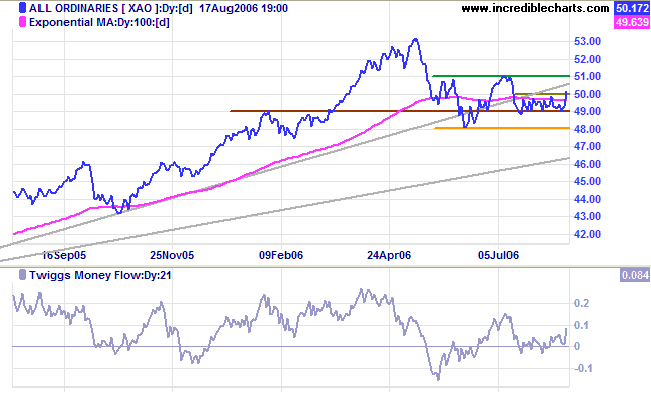
Long Term: The All Ordinaries is in a primary up-trend,
with support at 4800.
To sit home, read one's favorite paper, and
scoff at the misdeeds of the men who do things is easy, but it
is markedly ineffective. It is what evil men count upon the
good men's doing.
~ Theodore Roosevelt (1895).
~ Theodore Roosevelt (1895).
For more background information, read About
the Trading Diary.