Monday Update
By Colin Twiggs
July 31, 2006
July 31, 2006
We are trialing a quick update at the start of the week and a
detailed weekly newsletter on Thursdays. I am doing a fair
amount of traveling so delivery times may vary. Your feedback
will be appreciated.
These extracts from my daily trading diary are for educational purposes and should not be interpreted as investment advice. Full terms and conditions can be found at Terms of Use.
These extracts from my daily trading diary are for educational purposes and should not be interpreted as investment advice. Full terms and conditions can be found at Terms of Use.
USA
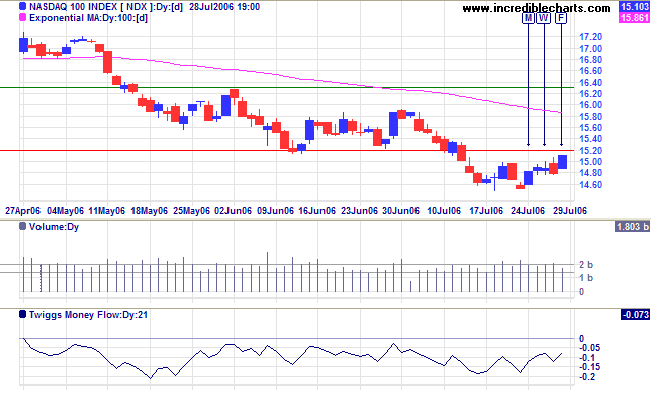
The Nasdaq 100 is again testing resistance at 1520. A
close above this level would indicate that the recent trend
reversal is likely to resolve into a
bear trap, while a close below Thursday's low of 1480 would
be a bear signal -- and a break below 1450 would confirm the
primary down-trend.
Twiggs Money Flow (21-day) has remained below zero for 3
months, signaling strong long-term
distribution.
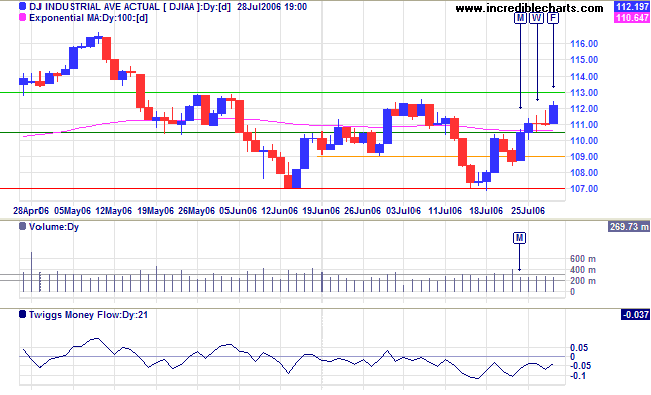
The Dow Industrial Average is headed for a test of
resistance at 11300. A close above this level would signal a
test of resistance at 11650 while reversal would mean another
test of primary support at 10700.
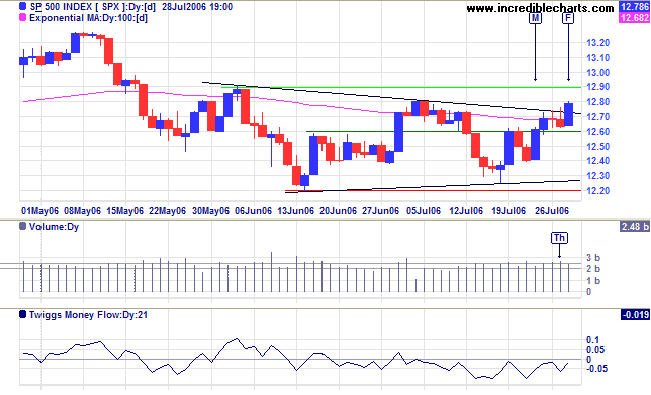
The S&P 500 made a bullish breakout from the recent
symmetrical triangle (highlighted with dark blue lines). A
close above 1290 would confirm the end of the secondary
correction and signal a test of the May high of 1325. However,
Twiggs Money Flow (21-day) holding below the zero line
continues to signal
distribution.
Gold
Spot gold is headed for another test of resistance at $680. A breakout above this level would signal a rally to test the May high of $725. Failure to penetrate resistance, however, would mean another test of $620..
Spot gold is headed for another test of resistance at $680. A breakout above this level would signal a rally to test the May high of $725. Failure to penetrate resistance, however, would mean another test of $620..
Currencies
The US Dollar Index is headed for a test of intermediate support at 84.75. Failure of this level would test primary support at 83.50. If the level holds, that would mean another test of resistance at 87.00.
The US Dollar Index is headed for a test of intermediate support at 84.75. Failure of this level would test primary support at 83.50. If the level holds, that would mean another test of resistance at 87.00.
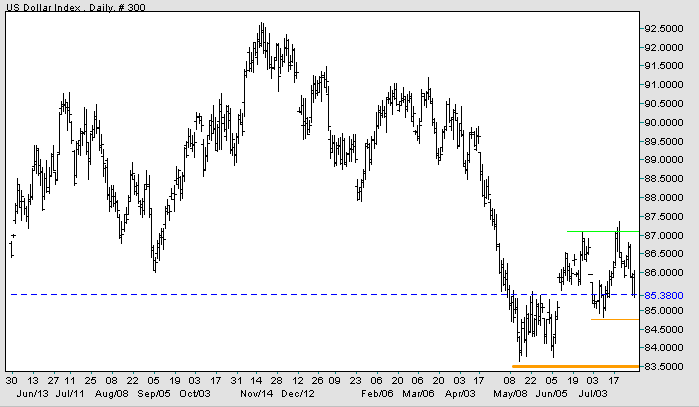
Source: Netdania
United Kingdom
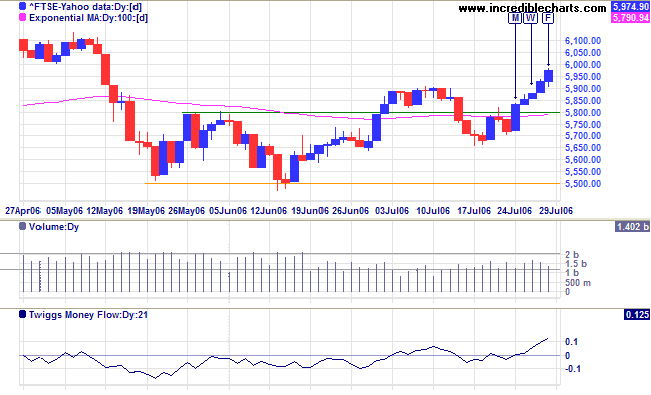
The FTSE 100 is rallying after a higher low (mid-July) and a new high. Expect a test of resistance at the recent high of 6130. Twiggs Money Flow (21-day) is trending upwards, signaling accumulation.
The FTSE 100 is rallying after a higher low (mid-July) and a new high. Expect a test of resistance at the recent high of 6130. Twiggs Money Flow (21-day) is trending upwards, signaling accumulation.
Japan
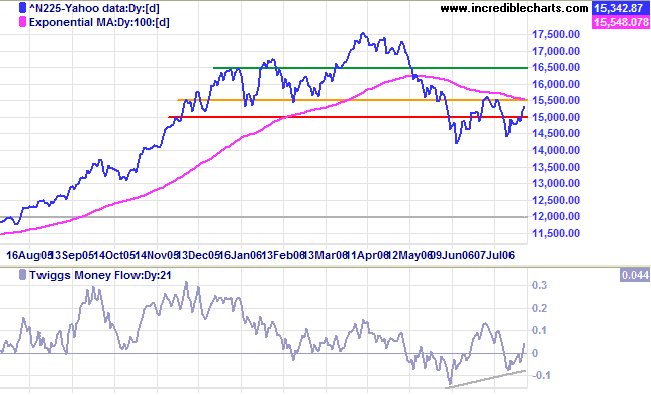
The Nikkei 225 is headed for another test of resistance at 15500. The recent higher low is a bullish sign and a breakout above 15500 would signal reversal of the primary down-trend. However, if the index respects the 100-day exponential moving average from below, that would confirm the down-trend. Twiggs Money Flow (21-day) is completed a higher low: a positive sign.
The Nikkei 225 is headed for another test of resistance at 15500. The recent higher low is a bullish sign and a breakout above 15500 would signal reversal of the primary down-trend. However, if the index respects the 100-day exponential moving average from below, that would confirm the down-trend. Twiggs Money Flow (21-day) is completed a higher low: a positive sign.
ASX Australia
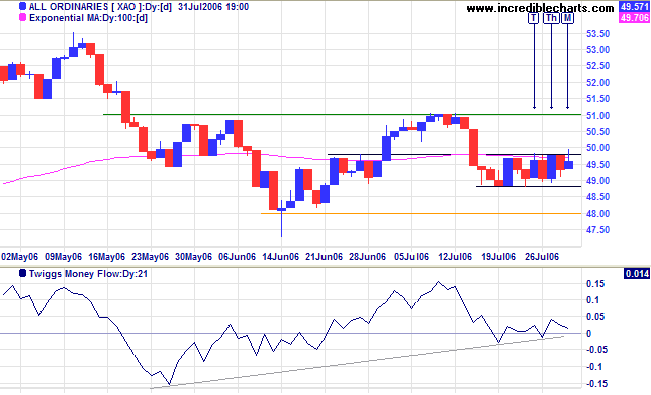
The All Ordinaries is consolidating between 4880 and 4980. A close above the rectangle would signal a test of 5100, while a close below would mean a test of primary support at 4800. Breakout above 5100 would signal the start of an up-trend.
The All Ordinaries is consolidating between 4880 and 4980. A close above the rectangle would signal a test of 5100, while a close below would mean a test of primary support at 4800. Breakout above 5100 would signal the start of an up-trend.
For more background information, read About
the Trading Diary.

Author: Colin Twiggs is a former investment banker with almost 40 years of experience in financial markets. He co-founded Incredible Charts and writes the popular Trading Diary and Patient Investor newsletters.
Using a top-down approach, Colin identifies key macro trends in the global economy before evaluating selected opportunities using a combination of fundamental and technical analysis.
Focusing on interest rates and financial market liquidity as primary drivers of the economic cycle, he warned of the 2008/2009 and 2020 bear markets well ahead of actual events.
He founded PVT Capital (AFSL No. 546090) in May 2023, which offers investment strategy and advice to wholesale clients.