Trading Diary
May 20, 2006
These extracts from my daily trading diary are for educational
purposes and should not be interpreted as investment advice. Full
terms and conditions can be found at Terms
of Use.
USA
The Big Picture: Several equity
markets and transport indicators have
started secondary corrections, but remain in primary up-trends. A
weakening dollar may boost export sales, but
drive long-term interest rates and oil prices upwards, offsetting any positive benefit.
The Wright Model reflects the risk of an
economic downturn as modest. The bull market remains intact
though we can expect some turbulence ahead.
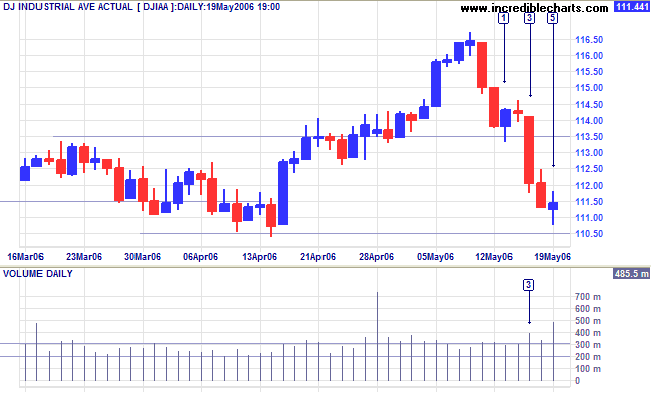
The Dow Industrial Average appears headed for a secondary
correction after the sharp decline in preliminary consumer
sentiment figures from the University of Michigan raised fears of
a fall in retail sales. Buying support evident at [1] and [2] was
overcome by sellers, signaled by the large red candle and strong
volume at [3]. Further buying support is indicated by the
doji and strong volume at [5], but the market remains
bearish. A fall below 11050 would confirm the secondary
correction.
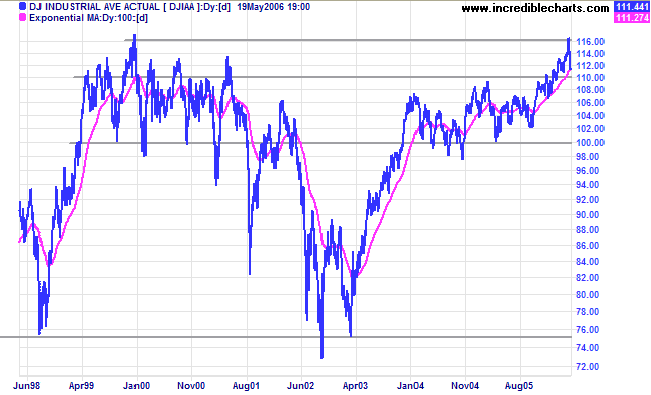
Medium Term: We can see, on the chart below, that the
market reversed close to the January 2000 high.
Respect of support at 11000 would be bullish, while a fall
below this level would suggest a test of primary support at
10000.
Twiggs Money Flow (21-day) is below zero, signaling
distribution.
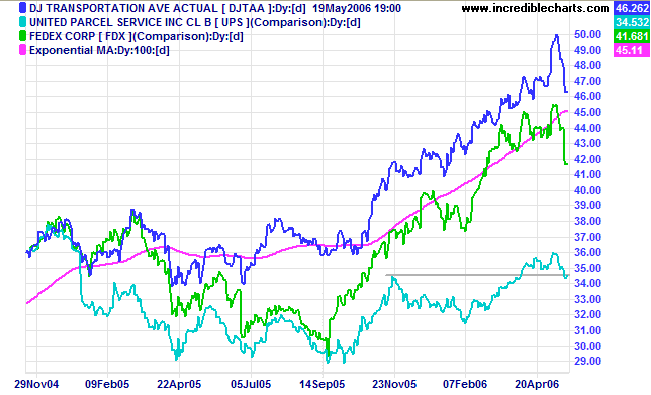
Long Term: Both the Dow Industrial and Transport Averages are in primary up-trends, confirming a bull market despite the current turbulence.
Long Term: Both the Dow Industrial and Transport Averages are in primary up-trends, confirming a bull market despite the current turbulence.
The Dow Jones Transportation Average and lead indicators,
Fedex and UPS, all started secondary corrections but remain in
primary up-trends.
The S&P 500 broke through support at 1285, as well as
the linear regression line and the 100-day
exponential moving average, signaling the start of a
secondary correction.
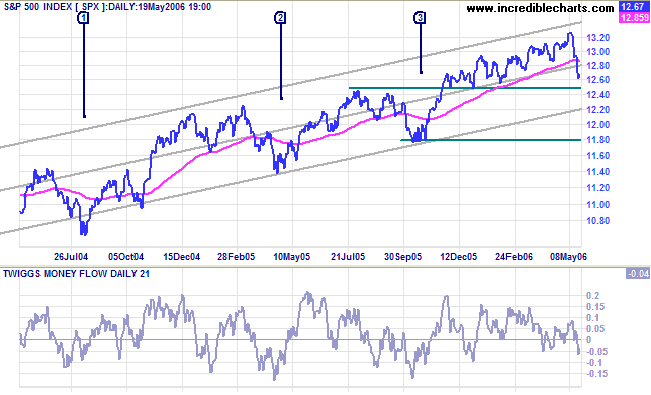
Medium Term: Respect of support at 1250 would be bullish;
while a break below the standard deviation channel would be a
bearish sign; and a close below support at 1180 would signal a
primary trend reversal.
Twiggs Money Flow (21-day) below zero signals
distribution.
Long Term: The index is in a slow up-trend, with primary support at 1180.
Long Term: The index is in a slow up-trend, with primary support at 1180.
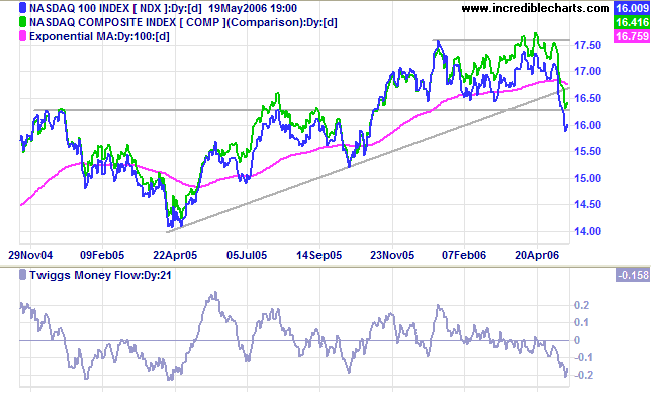
The Nasdaq 100 fell sharply through support at 1630, after
consolidating above this level for several months. I am tempted
to call this a primary trend reversal from a
ranging market, but the consolidation pattern was loose and
prudence dictates that we wait for a test of support at 1520.
Twiggs Money Flow (21-day) confirms strong
distribution.
Treasury yields
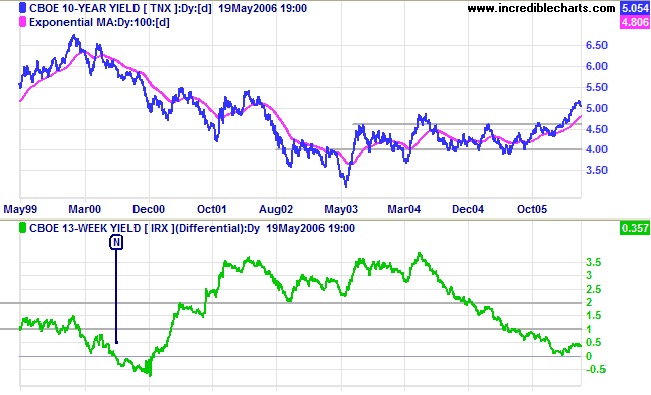
The 10-year treasury yield retraced slightly, but remains in a strong up-trend, aided by the weakening dollar.
Medium Term: Concerns about inflation suggest that the expected pause in rate hikes is far from certain. The real estate market is likely to be worst affected by rising long-term rates, while banks will benefit from wider margins.
Long Term: The yield differential (10-year T-notes minus 13-week T-bills) is trending slowly upwards. This is a good sign as a low yield differential poses a significant threat when short-term interest rates rise.
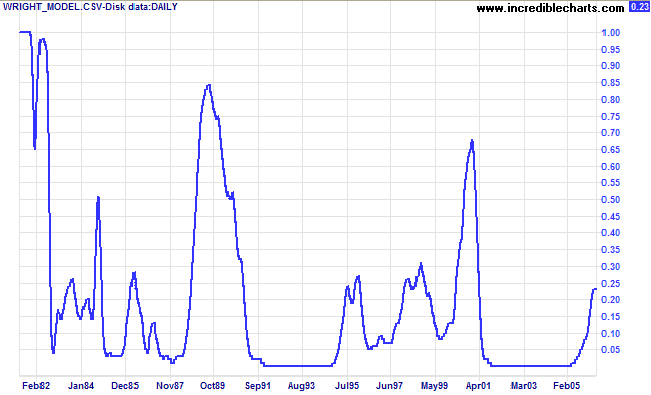
Wright Model
Developed recently by Fed economist Jonathan H Wright, the Wright Model combines the yield differential and fed funds rate to calculate the probability of recession. Looking ahead at the next four quarters, the probability remains a modest 23%.
Developed recently by Fed economist Jonathan H Wright, the Wright Model combines the yield differential and fed funds rate to calculate the probability of recession. Looking ahead at the next four quarters, the probability remains a modest 23%.
Gold
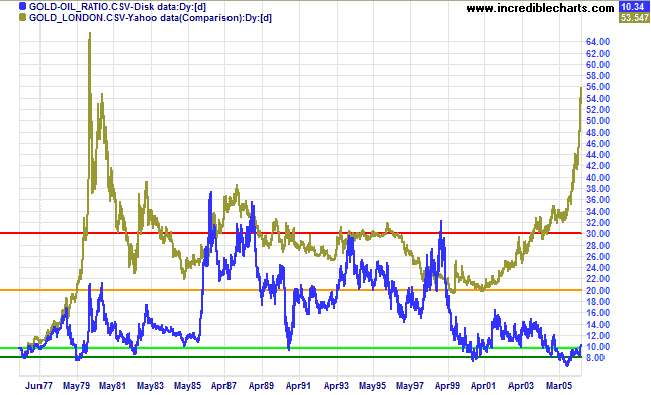
Spot gold fell sharply to close at $657.00 in New York; a long way from the recent high of $725.
Medium Term: The recent upward spike is now being followed by a typical sharp reversal.
Long Term: The gold-oil ratio is rising. Down-turns above 20 indicate selling opportunities. Expect gold to make further gains if crude oil rallies above $70/barrel.
Data Source: Global
Financial Data
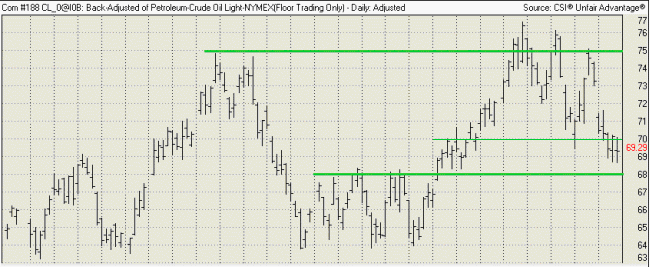
Crude Oil
Crude shows signs of weakness, falling below $70 per barrel. However, support is evident at $68 and a rise above $70 will signal a likely test of resistance at the recent high of $75. Further gains can be expected if there is a break above $75, but a fall below $68 would be a bear signal -- confirmed if a retracement respects resistance at $68.
Crude shows signs of weakness, falling below $70 per barrel. However, support is evident at $68 and a rise above $70 will signal a likely test of resistance at the recent high of $75. Further gains can be expected if there is a break above $75, but a fall below $68 would be a bear signal -- confirmed if a retracement respects resistance at $68.
Currencies
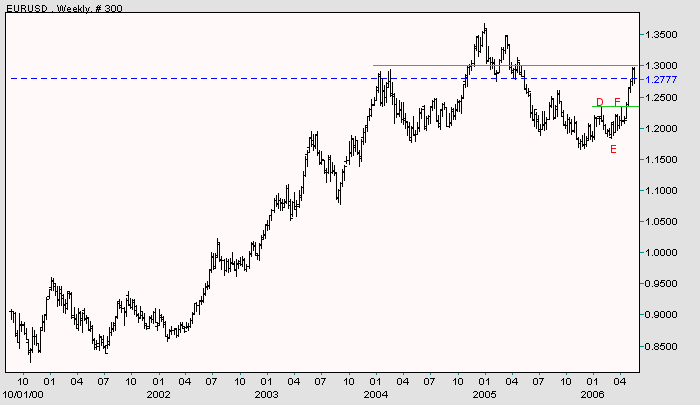
The dollar is weakening against major trading partners.
EUR/USD: The euro found resistance at 1.30 (the early 2004 high) against the dollar. We may see a retracement test support at [D] and [F] before another attempt at 1.35/1.36. The euro is in a primary up-trend.
The dollar is weakening against major trading partners.
EUR/USD: The euro found resistance at 1.30 (the early 2004 high) against the dollar. We may see a retracement test support at [D] and [F] before another attempt at 1.35/1.36. The euro is in a primary up-trend.
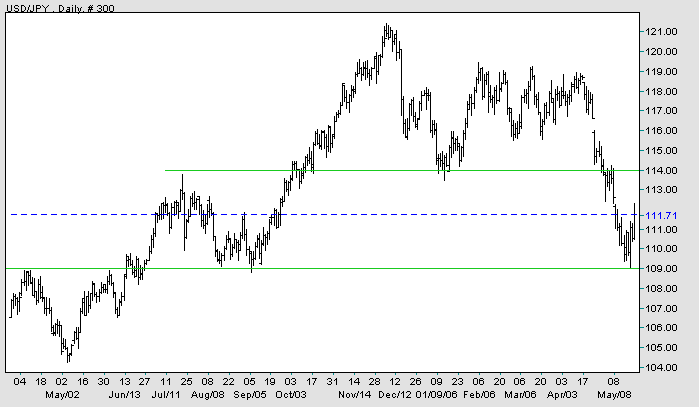
USD/JPY: The dollar found support at 109 against the yen and may
retrace to test resistance at the previous support level of 114.
The primary down-trend continues.
Source: Netdania
United Kingdom
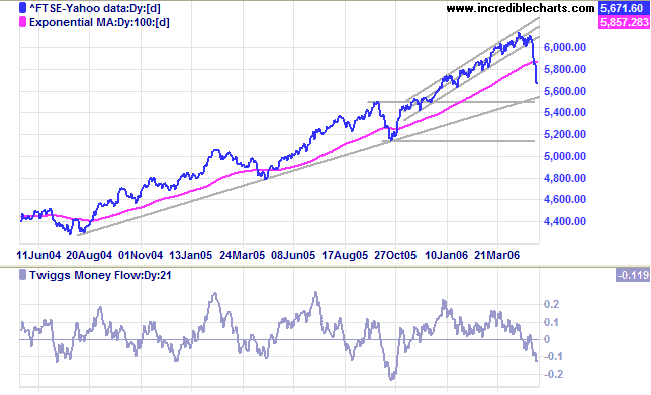
Last week the FTSE 100 broke through the lower border of the channel at [5], signaling the start of a secondary correction. The fall continued this week with strong red candles and little support, breaking through the 100-day exponential moving average (another bear signal) and heading for a test of support at 5500.
Medium Term: A fall through 5500 would test primary support at 5150; but respect of support at 5500 would be a long-term bull signal. Twiggs Money Flow (21-day) falling sharply below zero signals strong distribution.
Long Term: The FTSE 100 remains in a primary up-trend, with primary support at 5150.
Japan
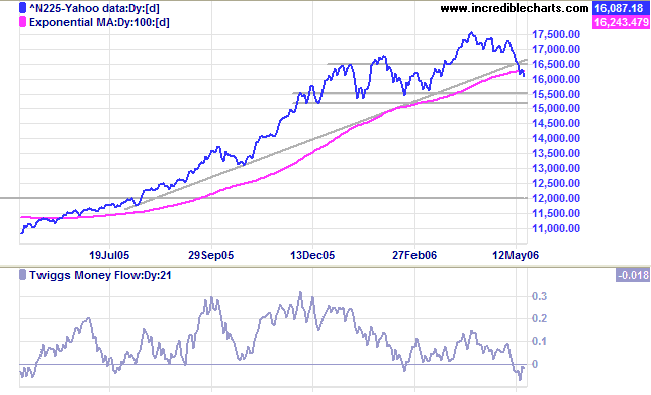
Support at 16500 on the Nikkei 225 has failed and the index appears headed for a test of primary support at 15500/15000.
Medium Term: The index broke the long-term trendline, indicating a loss of momentum, and Twiggs Money Flow (21-day) below zero signals short-term distribution. If support holds, expect some consolidation before a rally to test resistance at 17500. If support at 15000 fails, however, the primary trend will reverse downwards.
Long Term: The primary up-trend may be forming a stage 3 top.
ASX Australia
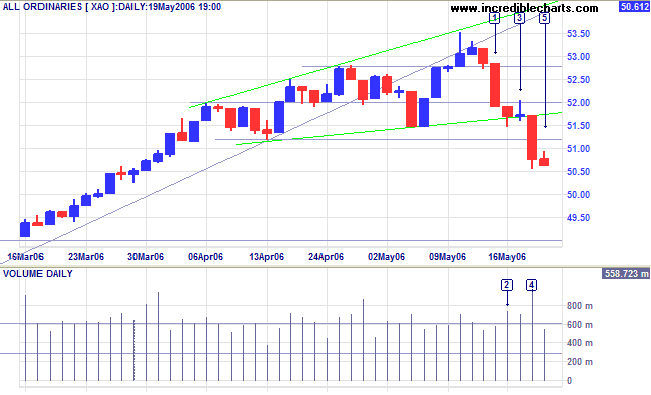
The All Ordinaries fell through support at 5280 with a strong red candle at [1]. Buyers came out in support, with the candle at [2] displaying a long tail and strong volume. However, the narrow trading ranges and gravestone doji, with a tall shadow and strong volume at [3], signaled the presence of large numbers of sellers. The long red candle at [4] broke out below the rising broadening wedge pattern identified by green lines on the chart below, with exceptional volume at [4] signaling the presence of buyers as well as sellers. The opposition of buyers and sellers continues with the narrow range at [5], but the weak close indicates that sellers may be gaining the upper hand. The likely scenario is a weak rally testing resistance at 5120/5150 followed by further strong red candles. Though unlikely, a rise above 5200, would signal a resurgence of buying pressure and an attempt to make a new high.
The All Ordinaries fell through support at 5280 with a strong red candle at [1]. Buyers came out in support, with the candle at [2] displaying a long tail and strong volume. However, the narrow trading ranges and gravestone doji, with a tall shadow and strong volume at [3], signaled the presence of large numbers of sellers. The long red candle at [4] broke out below the rising broadening wedge pattern identified by green lines on the chart below, with exceptional volume at [4] signaling the presence of buyers as well as sellers. The opposition of buyers and sellers continues with the narrow range at [5], but the weak close indicates that sellers may be gaining the upper hand. The likely scenario is a weak rally testing resistance at 5120/5150 followed by further strong red candles. Though unlikely, a rise above 5200, would signal a resurgence of buying pressure and an attempt to make a new high.
Medium Term: The completed wedge pattern on the above
chart is a strong bear signal; confirmed by the sharp fall to
below zero on
Twiggs Money Flow (21-day); and by the reversal below the
upper border of the linear regression channel. Expect a secondary
correction to test the lower border of the channel.
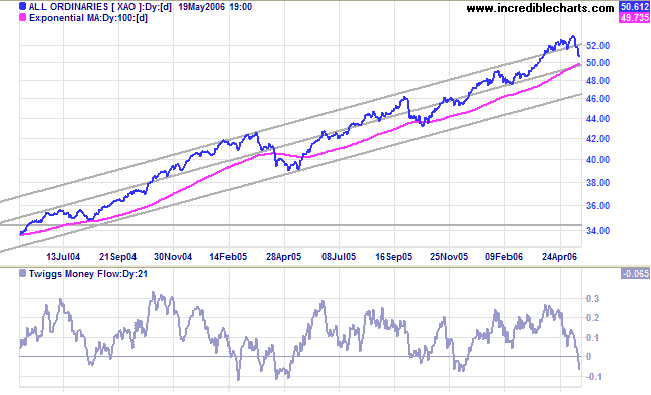
Long Term: The All Ordinaries remains in a strong primary
up-trend.
For further background information, read About
the Trading Diary.
Regards,
Regards,
Colin Twiggs
If there is light in the soul,
There will be beauty in the person.
If there is beauty in the person,
There will be harmony in the house.
If there is harmony in the house,
There will be order in the nation.
If there is order in the nation,
There will be peace in the world.
~Chinese Proverb
There will be beauty in the person.
If there is beauty in the person,
There will be harmony in the house.
If there is harmony in the house,
There will be order in the nation.
If there is order in the nation,
There will be peace in the world.
~Chinese Proverb

Author: Colin Twiggs is a former investment banker with almost 40 years of experience in financial markets. He co-founded Incredible Charts and writes the popular Trading Diary and Patient Investor newsletters.
Using a top-down approach, Colin identifies key macro trends in the global economy before evaluating selected opportunities using a combination of fundamental and technical analysis.
Focusing on interest rates and financial market liquidity as primary drivers of the economic cycle, he warned of the 2008/2009 and 2020 bear markets well ahead of actual events.
He founded PVT Capital (AFSL No. 546090) in May 2023, which offers investment strategy and advice to wholesale clients.