Trading Diary
May 28, 2005
These extracts from my daily trading diary are
for educational purposes and should not be interpreted as
investment advice. Full terms and conditions can be found at
Terms
of Use.
USA
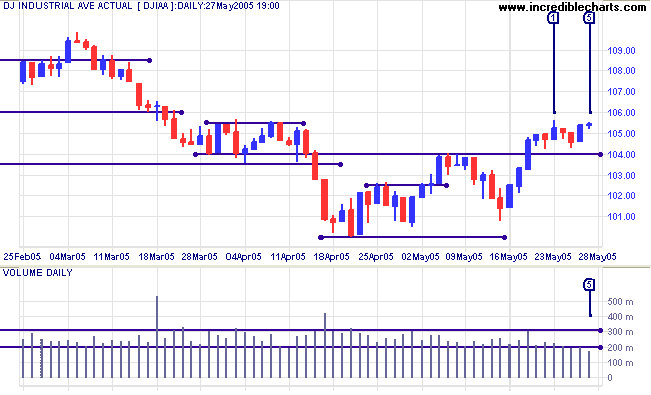
The Dow Industrial Average intermediate up-trend has lost momentum, consolidating in a narrow range above 10400 over the last week. Friday's narrow range and low volume at [5] are a result of the long weekend: the market is closed Monday for Memorial Day. A test of resistance at 10900 is the most likely outcome; while a close below 10400 is still a reasonable possibility and would signal a re-test of support at 10000.
The Dow Industrial Average intermediate up-trend has lost momentum, consolidating in a narrow range above 10400 over the last week. Friday's narrow range and low volume at [5] are a result of the long weekend: the market is closed Monday for Memorial Day. A test of resistance at 10900 is the most likely outcome; while a close below 10400 is still a reasonable possibility and would signal a re-test of support at 10000.
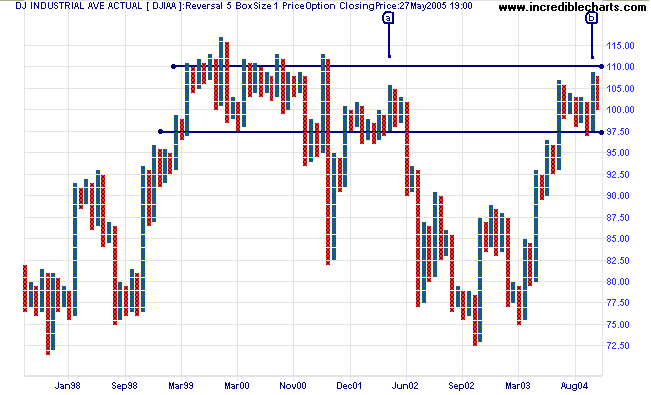
Although we are in an intermediate up-trend at present and
Twiggs Money Flow (21-day) is above recent highs, signaling
accumulation, the index is likely to encounter fierce resistance
around 11000. We could well suffer a repeat of the pattern at
[a], despite buying support between 10000 and 9750, the October
low. Resolution of this latest "top" may take time and the
direction of the final breakout is by no means certain.
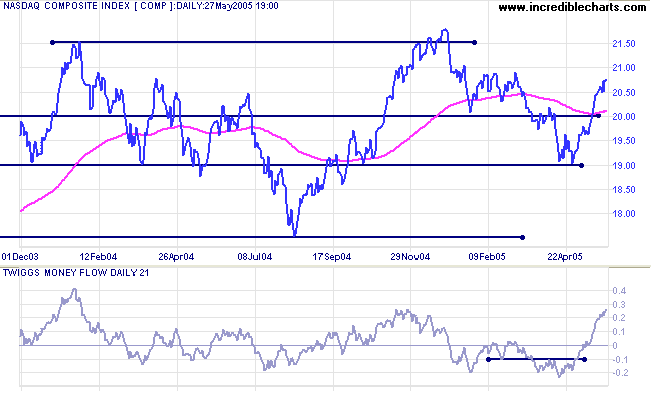
The Nasdaq Composite is climbing strongly and
Twiggs Money Flow (21-day) signals active accumulation
(intermediate term).
Expect a test of resistance at 2150 which may trigger strong selling. If resistance holds, then a re-test of support at 1900 is likely.
A close above 2180, on the other hand, would signal resumption of the primary up-trend.
Expect a test of resistance at 2150 which may trigger strong selling. If resistance holds, then a re-test of support at 1900 is likely.
A close above 2180, on the other hand, would signal resumption of the primary up-trend.
The S&P 500 intermediate up-trend has lost momentum,
consolidating below 1200 for the last week; accompanied by
declining volume. The narrow range and low volume on Friday [5]
are due to the long weekend. A re-test of support at 1165 is
still a reasonable possibility, while a breakout above 1200 to
test resistance at 1225 (the March 2005 high) is more likely.
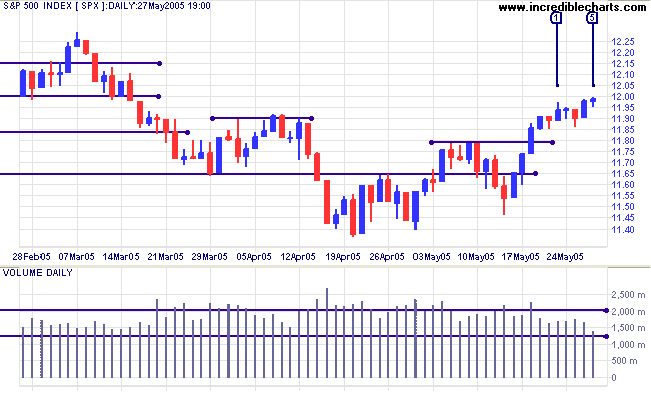
A successful test of support at 1160 would be a strong bull
signal.
Twiggs Money Flow (21-day) signals strong accumulation; a
pull-back that holds above zero would be a bullish sign.
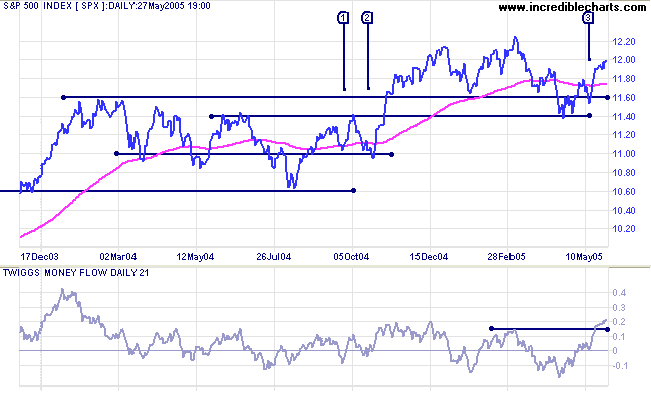
A close above 1225 would signal a primary up-trend.
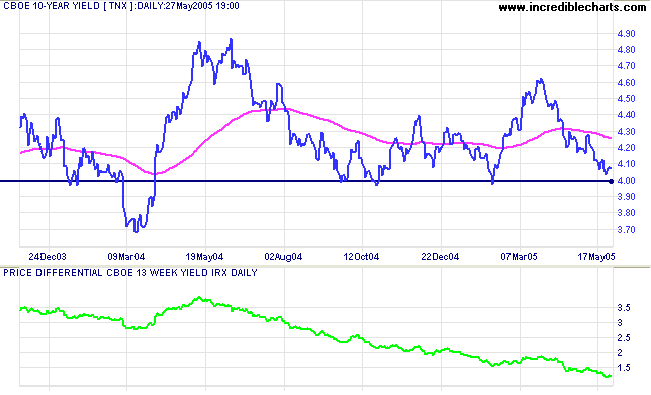
Treasury yields
The yield on 10-year treasury notes is headed for a test of support at 4.0%, while 13-week T-bills have risen to 2.8% from below 1.0% over the last year. This explains why the yield differential (10-year T-notes minus 13-week T-bills) has fallen to 1.2%. Below 1.0% would be a long-term bear signal for equities.
The yield on 10-year treasury notes is headed for a test of support at 4.0%, while 13-week T-bills have risen to 2.8% from below 1.0% over the last year. This explains why the yield differential (10-year T-notes minus 13-week T-bills) has fallen to 1.2%. Below 1.0% would be a long-term bear signal for equities.
Gold
New York: Spot gold is consolidating in a narrow band below resistance at $420, signaling (down-) trend weakness. The metal closed at 419.30 on Friday.
The primary trend will reverse downward if price falls below the February low of $410.
New York: Spot gold is consolidating in a narrow band below resistance at $420, signaling (down-) trend weakness. The metal closed at 419.30 on Friday.
The primary trend will reverse downward if price falls below the February low of $410.
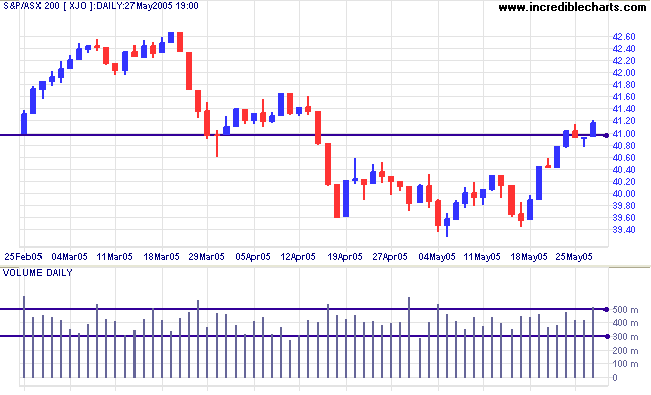
ASX Australia
The ASX 200 has broken through the first line of resistance at 4100 on strong volume. Unless there is a reversal early next week, this signals that the down-trend is weakening.
The ASX 200 has broken through the first line of resistance at 4100 on strong volume. Unless there is a reversal early next week, this signals that the down-trend is weakening.
The All Ordinaries has lagged behind the ASX 200 and is
still testing resistance at 4080, the first line of resistance
(from the February and March lows). The expected test of 4080 has
a good chance of success considering that the ASX 200 has already
penetrated.
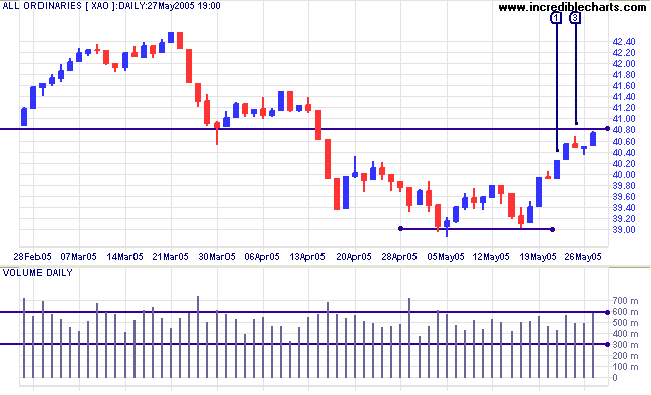
A break above 4080 would not signal a change in a primary trend,
merely that the trend is weakening. Only a rise above the high of
4255 would signal that the primary trend has reversed upwards.
Expect resistance at 4255 to be exceedingly strong -- investors
may take the opportunity to exit at close to the previous
high.
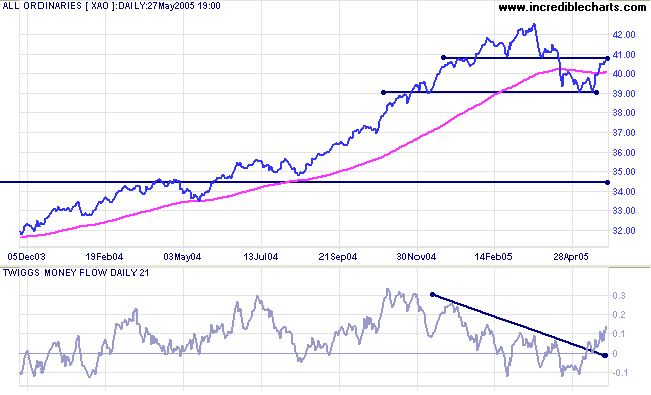
If resistance at 4080 holds then expect a test of support at 3900. Failure of that level would signal that a test of support at 3450 is likely, amounting to roughly a 50% retracement of the previous up-trend. If you review the All Ords over the past 25 years, the index has regularly cut back to test support at previous highs.
If resistance at 4080 holds then expect a test of support at 3900. Failure of that level would signal that a test of support at 3450 is likely, amounting to roughly a 50% retracement of the previous up-trend. If you review the All Ords over the past 25 years, the index has regularly cut back to test support at previous highs.
For further assistance, read About
the Trading Diary.
Colin Twiggs
First weigh the considerations, then take the
risks.
~ General Helmuth von Moltke (1848 - 1916)
~ General Helmuth von Moltke (1848 - 1916)
Back Issues
Access the Trading Diary Archives.