Trading Diary
March 5, 2005
These extracts from my daily trading diary are for educational
purposes and should not be interpreted as investment advice. Full
terms and conditions can be found at Terms
of Use.
USA
The Dow Industrial Average broke strongly above 10850/10860 after four days of consolidation below the resistance level.
This follows two bullish troughs on Twiggs Money Flow (21-day).
The Dow Industrial Average broke strongly above 10850/10860 after four days of consolidation below the resistance level.
This follows two bullish troughs on Twiggs Money Flow (21-day).
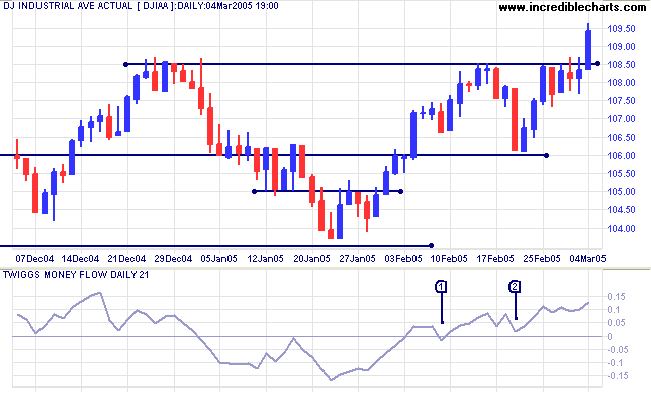
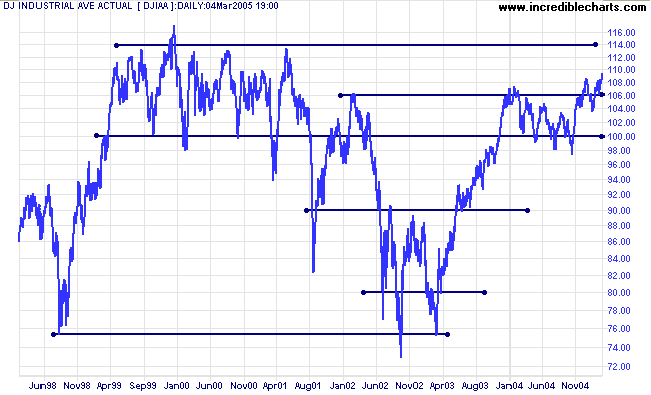
The rise above 10860 signals that a test of resistance at
11300/11400 can be expected.
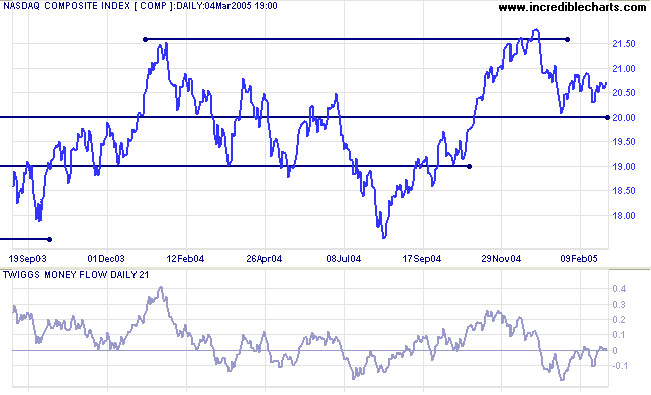
The Nasdaq Composite is weaker than the Dow and S&P
500, consolidating between 2000 and 2100.
Twiggs Money Flow continues to lurk below the zero line. A
break above 2100 would be bullish; a break below 2000 bearish.
The S&P 500 tested support at 1200 on Monday [1]:
strong volume and a long tail indicate that buyers were present
in numbers. The index then consolidated between 1200 and 1215
(the December 2004 high) for 3 days before breaking out on Friday
with a tall blue candle. This is a strong bull signal. A
pull-back that respects support at 1215 would add further
confirmation.
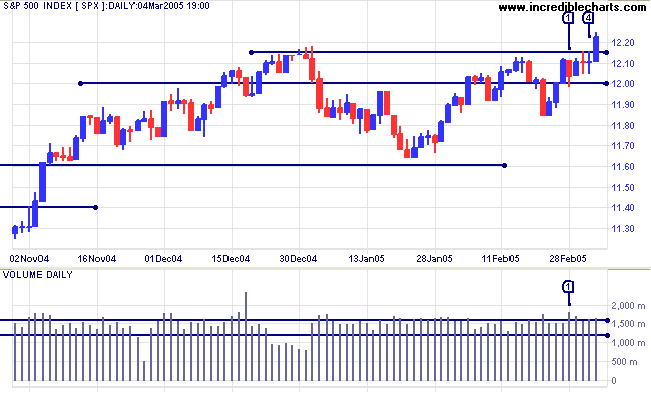
Twiggs Money Flow (21-day) is rising steeply after completing
two bullish troughs above zero at [1] and [2], signaling strong
accumulation.
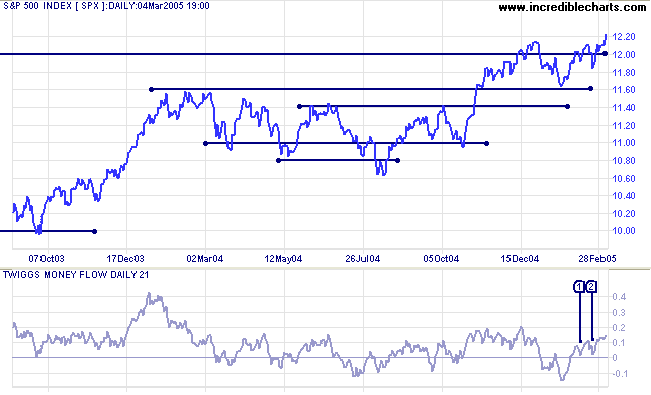
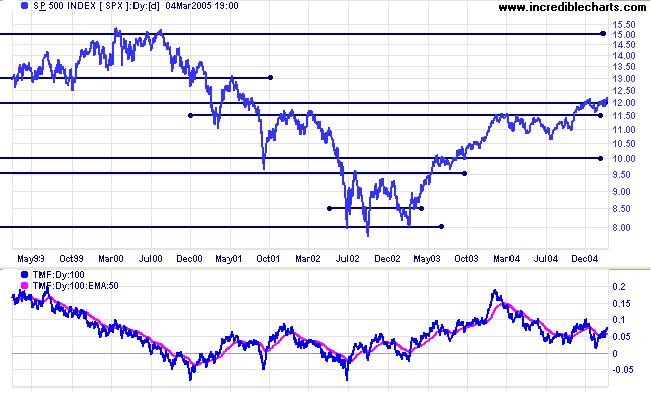
In the longer-term, expect the index to test resistance at 1300.
If the index breaks through this level, we should see a test of
the key resistance level at 1500.
The first line of support is at 1150/1160. The market has a positive outlook as long as the index stays north of this line.
Twiggs Money Flow (100-day) has risen above the signal line, signaling accumulation. A pull-back that fails to cross below the signal line would be a further bull signal.
The first line of support is at 1150/1160. The market has a positive outlook as long as the index stays north of this line.
Twiggs Money Flow (100-day) has risen above the signal line, signaling accumulation. A pull-back that fails to cross below the signal line would be a further bull signal.
|
|
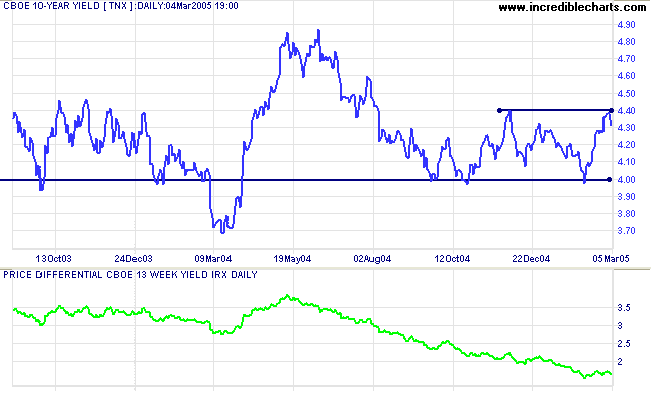
Treasury yields
The yield on 10-year treasury notes rallied to 4.40% before encountering resistance.
The yield differential (10-year T-notes minus 13-week T-bills) is consolidating at 1.6%.
Below 1.0% would be a (long-term) bear signal for equity markets.
The yield on 10-year treasury notes rallied to 4.40% before encountering resistance.
The yield differential (10-year T-notes minus 13-week T-bills) is consolidating at 1.6%.
Below 1.0% would be a (long-term) bear signal for equity markets.
Gold
New York: Spot gold dipped briefly below support at $430 on Friday before rallying strongly to close at $433.60.
Expect a test of resistance at $450.
New York: Spot gold dipped briefly below support at $430 on Friday before rallying strongly to close at $433.60.
Expect a test of resistance at $450.
|
ASX Australia
The All Ordinaries broke through initial resistance at 4130 on Monday [1], warning that the down-trend was weakening.
The breakout above the next resistance level at 4160 on Tuesday signaled that the intermediate trend had reversed upwards. Note the long tail and strong volume at [2], telling us that buyers had to overcome significant selling pressure before the breakout.
Thursday [4] tested the previous high of 4190 before Friday's strong rise confirmed that the primary trend had resumed.
Declining volume in the last three days warns that buyers may run out of steam. Watch for the first pull-back: if it respects support at 4183/4190, that would be a bullish sign. A retreat to 4160 would warn that the up-trend has slowed.
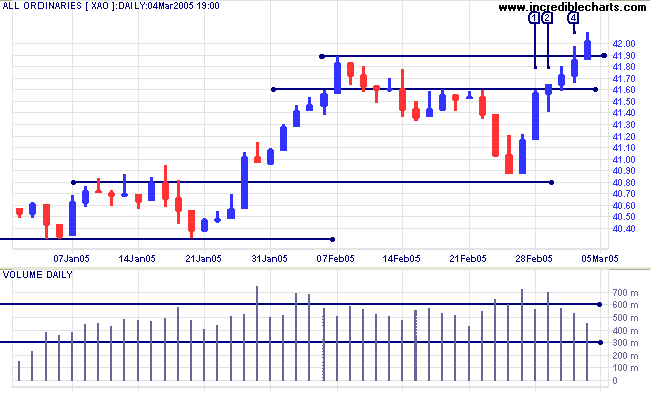
Twiggs Money Flow (21-day) rallied above the zero line.
Failure to hold above zero would be bearish: signaling continued
distribution.
Weekly reminder:
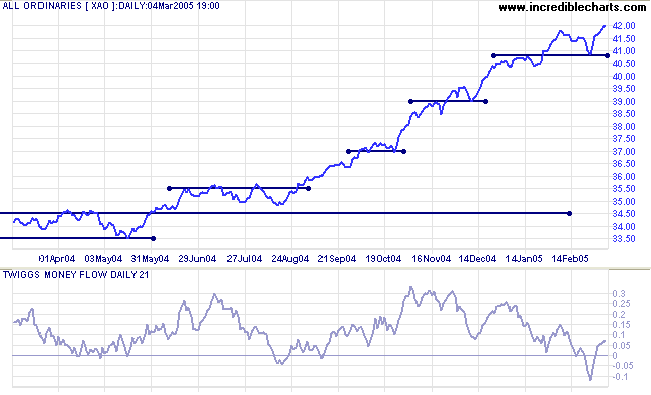
At some point there is likely to be a correction back to 3450. This is based on observation of the All Ords over the past 25 years, where the index has regularly tested support at previous long-term highs during an up-trend. This as a reminder not to get carried away with the bull market and to stay alert for signs of a reversal.
At some point there is likely to be a correction back to 3450. This is based on observation of the All Ords over the past 25 years, where the index has regularly tested support at previous long-term highs during an up-trend. This as a reminder not to get carried away with the bull market and to stay alert for signs of a reversal.
For further assistance, read About
the Trading Diary.
Colin Twiggs
Become more humble as the market goes your way.
~ Bernard Baruch
~ Bernard Baruch
Back Issues
Access the Trading Diary Archives.