Trading Diary Feedback

We have been advised to remove index coverage from the Daily Trading Diary as this may contravene the new Financial Services regulations. I feel that the Daily Diary will be decimated by the change and am inclined to stop the newsletter at the end of this month.

This will give me time to develop material for a new format based on  feedback from the recent survey:

  • trading education - construction and execution of a trading plan;

  • technical analysis - examination of various price and volume patterns, citing past examples;

  • examination of past trades - what went right and what went wrong;

  • indicators - strengths and weaknesses; and

  • training on Incredible Charts - how to get the most out of the Charts, Stock Screens, Forum and other aspects of the web site.

The survey also highlighted a need for earlier US updates and a wider array of data. We have taken this up with our data suppliers and will keep you appraised of developments.

We will credit members for the unexpired portion of their diary subscription. 

Please post your feedback or questions at Chart Forum: Trading Diary Feedback or contact members support.


Trading Diary
February 27, 2004

These extracts from my daily trading diary are for educational purposes and should not be interpreted as investment advice. Full terms and conditions can be found at Terms of Use .


USA (26th)
The Dow Industrial Average continues to show uncertainty, closing at 10580 after testing support levels at the opening. Higher volume is not that significant because of the weak close. A rise above Wednesday's high of 10615 will be bullish; a fall below Tuesday's low of 10521 will be bearish.
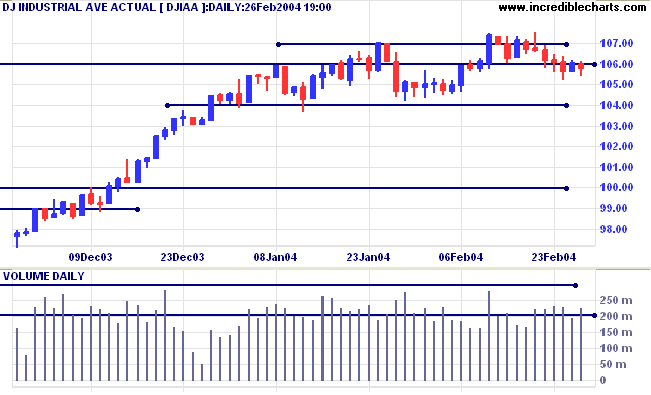
The intermediate trend is uncertain. A fall below support at 10400 would be bearish.
The primary trend is up. Resistance is at 11300 to 11350. A fall below support at 9600 would indicate the start of a down-trend.


The Nasdaq Composite continues to rally, closing at 2032 on higher volume. For the down-trend to remain strong, the swing should reverse in the next 2 to 3 days.
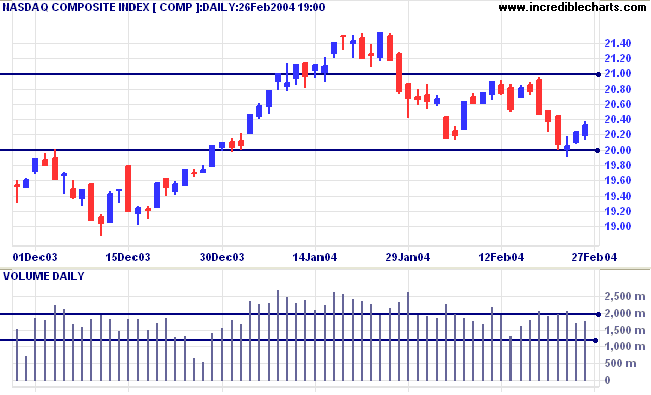
The intermediate trend is down. Narrow consolidation above the 2000 support level would be a bearish sign.
The primary trend is up. A fall below support at 1640 would signal reversal.


After a shaky start the S&P 500 rallied to a higher close at 1145 on reasonable volume.
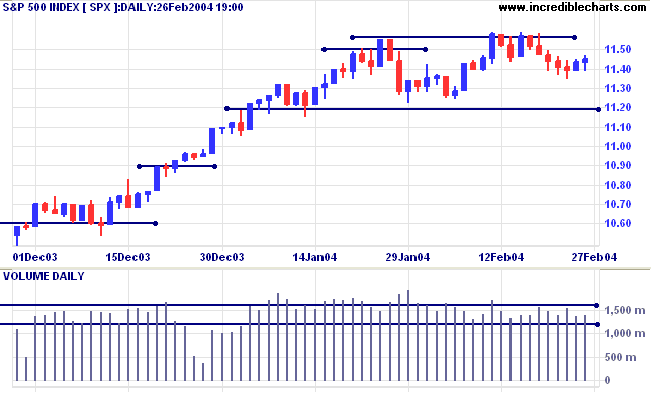
The intermediate trend is uncertain. A rise above 1155 would be bullish. A fall below support at 1120 would signal a down-trend.
The primary trend is up. Expect strong support at 1000. A fall below 960 would signal reversal.


The Chartcraft NYSE Bullish % Indicator is up slightly at 84.34%.


Gold
New York (Feb 27 03:54). Spot gold has fallen to $393.20.
The intermediate trend is down.
The primary trend is up. A fall below $370 would signal reversal.


ASX Australia
The All Ordinaries rallied to 3372 on strong volume, making a bullish penetration above the previous high.


The intermediate trend is up and we are likely to see a test of resistance at 3425 to 3450 (the previous highs from 2001 and 2002). A fall below support at 3270 would be bearish.
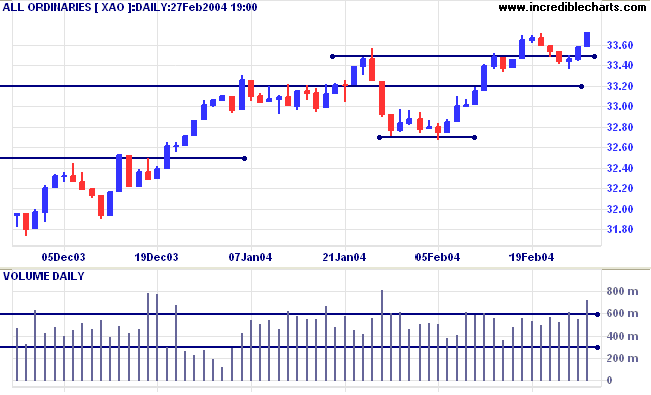
The primary trend is up. Support is at 3160.


Stock Screening - Trend Starts
A useful screen for identifying strong trends is the MACD
. MACD is a fairly short-term oscillator, plotting the difference between the 26- and 12-day exponential moving averages.
  • MACD (26,12,9): select bull signal within the last 3 days.
    If you are screening for stocks commencing a down-trend, select bear signal instead.
Crossovers will occur near the start of a trend but there are many false signals where MACD whipsaws around its signal line in a ranging market. Most of these false signals occur when MACD is, itself, whipsawing above and below the zero line. We can minimize these by selecting only bullish MACD crossovers that occur above the zero line, or bearish crossovers below.
  • MACD (26,12,9) above/below Zero: select bull signal within the last 9999 days.
    This will return all stocks where MACD is above zero.
    If you are screening for stocks commencing a down-trend, select bear signal instead.
  • Do a sort on the Stock Screen Return: click on the MACD (26,12,9,0) header to arrange stocks in terms of the number of days above zero. 
Start with the stocks that have the highest number of days (within reason) above zero and work your way down the list. Charts where MACD has been above zero for a really long time (e.g. SFE - 248 days and CTX - 236) may be mature trends that are close to reversal.

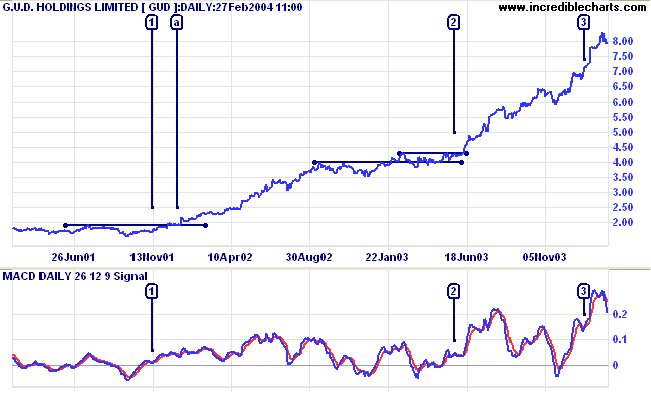
GUD Holdings is one of the better examples of what may turn up. MACD crossovers occur at [1] [2] and [3], while the indicator is above zero. The first two alert us to excellent setups - where price consolidates in a narrow range above a former resistance level, at [a] and at [2], before breaking into a strong up-trend.


Before you rush out and buy every stock where there is an MACD crossover above zero, Harvey Norman Holdings [HVN] is an example of how the signals may mis-fire: [1] to [5] are poor signals before [6] offers a reasonable setup. Most of the poor signals occurred shortly after MACD had crossed to above zero. More reliable signals are likely to be found where MACD has been above zero for at least a month.


The screen also fails to pick up reversal patterns like the narrow double bottom at [a] and [b]. So you should not use it to the exclusion of other screening techniques.


About the Trading Diary has been expanded to offer further assistance to readers, including directions on how to search the archives.

Colin Twiggs


In this game, the market has to keep pitching, but you don't have to swing.
You can stand there with the bat on your shoulder for six months until you get a fat pitch.

~ Warren Buffett.


Back Issues
You can now view back issues at the Daily Trading Diary Archives.


Back Issues
Access the Trading Diary Archives.