Automatic Free Trial
|
New subscribers will receive an
automatic free trial when they download Incredible
Charts. They will not have not have to click any buttons
in future to activate the free trial. The same will apply
to existing subscribers with unexpired free
trials. |
Trading Diary
February 20, 2004
These extracts from my daily trading diary are
for educational purposes and should not be interpreted as
investment advice. Full terms and conditions can be found at
Terms
of Use .
USA
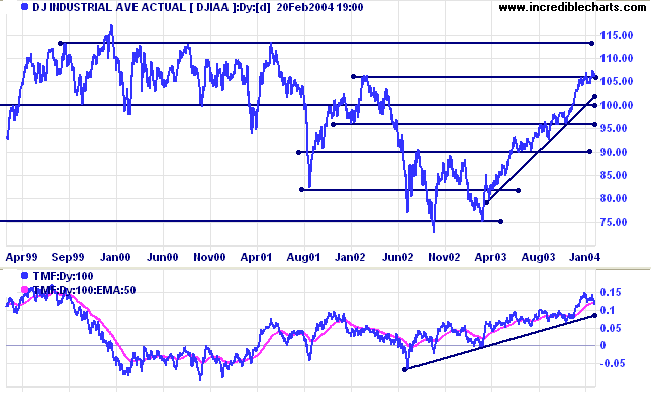
The Dow Industrial Average closed at 10619 after testing support
at 10600.
A fall below the January 29 low of 10417 would signal a re-test of support at 10000.
A fall below the January 29 low of 10417 would signal a re-test of support at 10000.
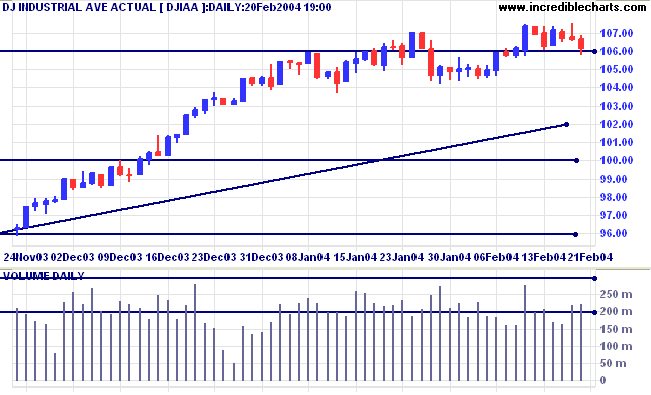
The primary trend is up. Resistance is at 11300 to 11350. A fall
below support at 9600 would indicate the start of a
down-trend.
Twiggs Money Flow gives a weak distribution signal, having broken below its signal line.
Twiggs Money Flow gives a weak distribution signal, having broken below its signal line.
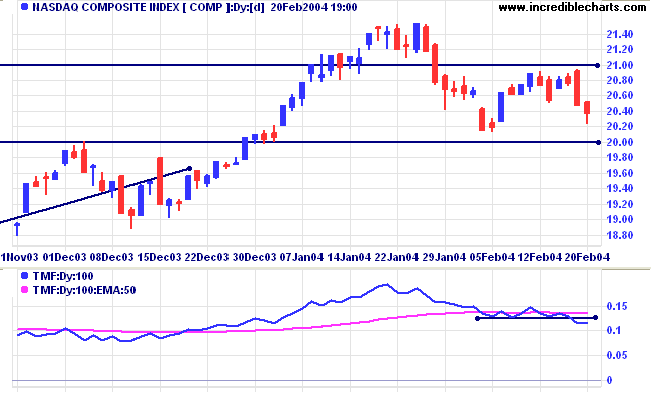
The Nasdaq Composite closed down at 2037. The weak close and
reasonable volume signal some buying support, which may result in
a consolidation similar to the one following January
29.
The intermediate trend is down. Support is at 2000.
The primary trend is up. A fall below support at 1640 would signal reversal.
Twiggs Money Flow is below its signal line. A retracement that fails to cross above this line would give a strong bear signal.
The intermediate trend is down. Support is at 2000.
The primary trend is up. A fall below support at 1640 would signal reversal.
Twiggs Money Flow is below its signal line. A retracement that fails to cross above this line would give a strong bear signal.
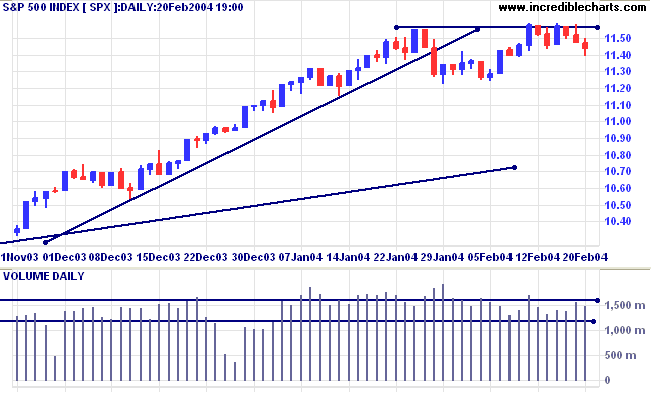
The S&P 500 has crossed below the previous low of 1133. The
weak close and reasonable volume indicates some buying
pressure.
The intermediate trend is uncertain. A rise above 1155 would be bullish. A fall below support at 1122 would signal a down-trend.
The primary trend is up. Expect strong support at 1000. A fall below 960 would signal reversal.
The intermediate trend is uncertain. A rise above 1155 would be bullish. A fall below support at 1122 would signal a down-trend.
The primary trend is up. Expect strong support at 1000. A fall below 960 would signal reversal.
The Chartcraft NYSE Bullish % Indicator retreated
sharply to 85.49%.
Jobless claims lower
New unemployment claims fell to 344,000, compared to 368,000 the week before. (more)
New unemployment claims fell to 344,000, compared to 368,000 the week before. (more)
Treasury yields
The yield on 10-year treasury notes closed at 4.10%.
The intermediate trend is down.
The primary trend is up. A bearish descending triangle has formed on the weekly chart; a close below the low of 3.93% would signal reversal.
The yield on 10-year treasury notes closed at 4.10%.
The intermediate trend is down.
The primary trend is up. A bearish descending triangle has formed on the weekly chart; a close below the low of 3.93% would signal reversal.
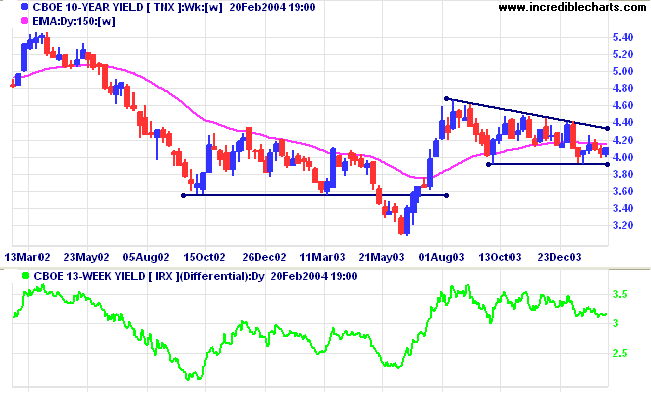
The
yield differential (10-year T-notes compared to 13-week
T-bills) is a healthy 3.2%. See
Interest Rates for an explanation of the yield differential.
Gold
New York: Spot gold fell through support at 400, closing at $397.20.
The intermediate trend is down.
The primary trend is up. A fall below $370 would signal reversal.
New York: Spot gold fell through support at 400, closing at $397.20.
The intermediate trend is down.
The primary trend is up. A fall below $370 would signal reversal.
Subscribe
to Incredible Charts:
|
for only $18 (AUD) per month
ASX Australia
The All Ordinaries retreated to 3359. Lighter volume indicates
that sellers lack commitment.
For the fast up-trend to continue, the index must respect support at 3350. A follow-through above the high of 3372 will be a bull signal. A fall below Monday's low of 3333 would be bearish.
For the fast up-trend to continue, the index must respect support at 3350. A follow-through above the high of 3372 will be a bull signal. A fall below Monday's low of 3333 would be bearish.
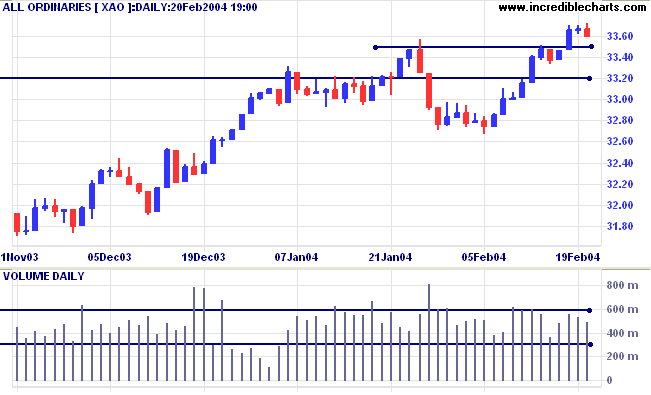
The intermediate trend is up. A fall below support at 3320 would
be bearish.
The primary trend is up. Resistance is at the 2001/2002 highs of 3425 and 3440. Support is at 3160.
The primary trend is up. Resistance is at the 2001/2002 highs of 3425 and 3440. Support is at 3160.
Sectors
The 11 sectors (10 + Property) are in various market stages. Relative Strength (xjo) measures the performance of each sector relative to the overall index.
The 11 sectors (10 + Property) are in various market stages. Relative Strength (xjo) measures the performance of each sector relative to the overall index.
- Energy [XEJ] - stage 2 (RS is rising)
- Materials [XMJ] - stage 2 (RS is level)
- Industrials [XNJ] - stage 2 (RS is rising)
- Consumer Discretionary [XDJ] - stage 3 (RS is level)
- Consumer Staples [XSJ] - stage 3 (RS is falling)
- Health Care [XHJ] - stage 1 (RS is falling)
- Property Trusts [XPJ] - stage 3 (RS is level).
- Financial excl. Property [XXJ] - stage 2 (RS is rising)
- Information Technology [XIJ] - stage 3 (RS is level)
- Telecom Services [XTJ] - stage 3 (RS is falling)
- Utilities [XUJ] - stage 2 (RS is level)
Sectors: Relative Strength
A stock screen of the ASX 200 using % Price Move (1 month: +5%) increased to 40 stocks, from 21 two weeks ago.
The highest reading was 131 on April 11, 2003 and the lowest was 8 on March 14, 2003.
Prominent sectors:
(The figure in brackets show the number of stocks returned from that industry).
A stock screen of the ASX 200 using % Price Move (1 month: +5%) increased to 40 stocks, from 21 two weeks ago.
The highest reading was 131 on April 11, 2003 and the lowest was 8 on March 14, 2003.
Prominent sectors:
- Diversified Metals & Mining (5)
- Construction Materials (3)
- Banks (3)
(The figure in brackets show the number of stocks returned from that industry).
About
the Trading Diary has been expanded to offer further
assistance to readers, including directions on how to search the
archives.
Colin Twiggs
We are what we repeatedly do - excellence is not an activity, but
a habit.
~ Aristotle.
~ Aristotle.
Back Issues
You can now view back issues at the Daily Trading Diary Archives.
You can now view back issues at the Daily Trading Diary Archives.
Back Issues
Access the Trading Diary Archives.